Editorial note: This article is for informational and educational purposes only. It is not financial advice or a recommendation to buy, sell, or hold Bitcoin or any cryptocurrency. Crypto markets are highly volatile. Always verify data with official sources. Last updated: May 14, 2026.
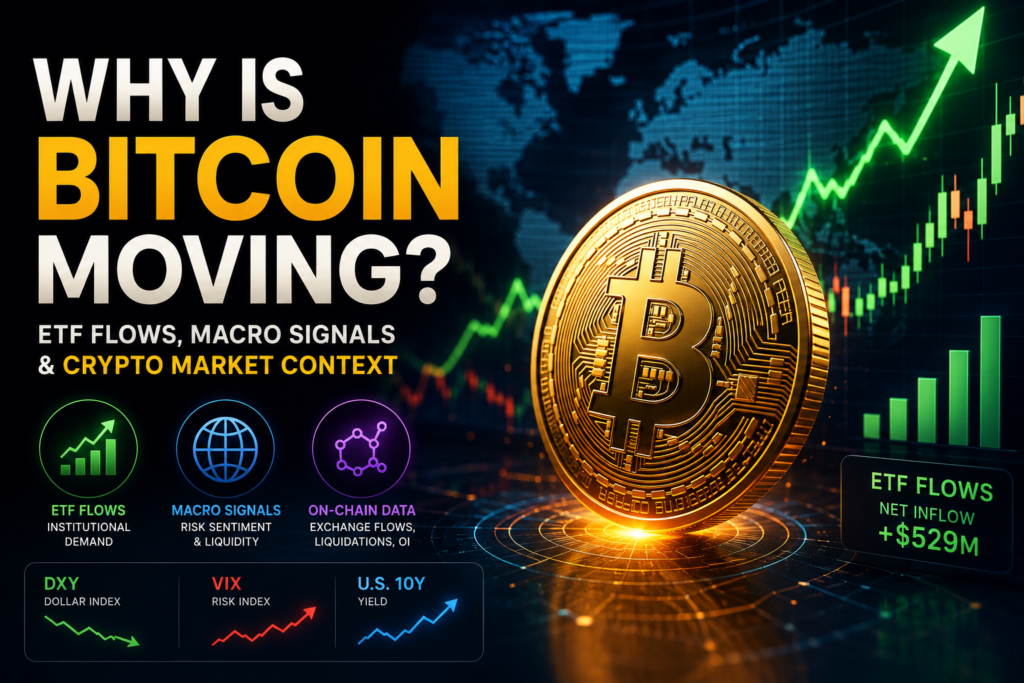
Bitcoin is the largest cryptocurrency by market capitalization and often moves before the rest of the crypto market. Understanding what drives Bitcoin requires looking at multiple overlapping signals. No single signal confirms direction. This explainer breaks down the most reliable Bitcoin price catalysts.
Top 3 Drivers Behind Bitcoin Price Moves
| Driver | What to Track | Source to Verify |
|---|---|---|
| Spot ETF flows | Daily net inflows/outflows from U.S. spot Bitcoin ETFs | BlackRock (IBIT), Fidelity (FBTC), Ark (ARKB) daily reports |
| Macro risk sentiment | U.S. equity direction, dollar strength, bond yields, VIX level | Market data providers, Federal Reserve |
| On-chain and exchange signals | Exchange inflows/outflows, funding rates, open interest, whale activity | Glassnode, CryptoQuant, Coinglass, blockchain explorers |
1. Spot Bitcoin ETF Flows
Since U.S. spot Bitcoin ETF approval in January 2024, daily ETF flow data has become one of the most closely watched Bitcoin demand signals. Large net inflows suggest institutional or retail demand is increasing through regulated products. Large net outflows suggest selling pressure through the same channel.
Key ETF issuers to monitor: BlackRock (IBIT), Fidelity (FBTC), and Ark/21Shares (ARKB). Each issues daily holdings data. Third-party aggregators compile total net flow across all U.S. spot Bitcoin ETFs.
2. Macro Risk Sentiment
Bitcoin tends to behave as a risk asset. When equity markets are risk-on and the U.S. dollar is weakening, Bitcoin often moves higher alongside other risk assets. When the VIX spikes, bond yields surge, or the dollar strengthens sharply, Bitcoin often faces selling pressure. This correlation is not constant — supply-side crypto events or regulatory shocks can cause decoupling.
3. Liquidations, Funding Rates and Open Interest
- Liquidations: Forced closing of leveraged positions. Large liquidation events amplify price moves in both directions.
- Funding rates: Cost of holding perpetual futures. Elevated positive funding signals overleveraged longs that can become unstable.
- Open interest: Total value of outstanding derivatives contracts. Rising OI with a price move may indicate increasing participation; falling OI may indicate position unwinding.
Reliable sources for derivatives data: Coinglass (coinglass.com) and Velo Data. Liquidation totals can vary across providers based on exchange coverage.
Key Signals Table
| Signal | Bullish Context | Bearish Context | Reliability Note |
|---|---|---|---|
| ETF daily net flows | Sustained positive inflows | Multi-day outflows | High — directly measures institutional demand |
| Exchange outflows | Coins leaving exchanges | Coins flowing to exchanges | Medium — context-dependent |
| Funding rates | Neutral to slightly positive | Extreme positive (overleveraged longs) | Medium — short-term signal |
| Macro risk-on/off | Equities rising, dollar falling, VIX falling | Equities falling, dollar rising, VIX rising | Medium — not always correlated |
Risks and Uncertainty
- Bitcoin can move for multiple reasons simultaneously; no single signal confirms direction.
- Crypto data can vary significantly across providers.
- Regulatory announcements can cause sudden moves on-chain signals do not anticipate.
- Crypto markets operate 24/7. Moves can accelerate outside U.S. trading hours.
- This article does not predict future Bitcoin price movement.
What to Watch Next
- Daily ETF flow reports from major issuers
- Bitcoin funding rates and open interest on major exchanges
- U.S. CPI and macro data releases this month
- Any regulatory developments from the SEC or CFTC
Related EskiSignal Guides
- Crypto Liquidations and Derivatives: Leverage, Funding and OI Explained
- Whale and Exchange Flows: On-Chain Crypto Movement Signals
- Economic Calendar: CPI, FOMC and Key Macro Dates
FAQ
What is a Bitcoin spot ETF and why does it affect price?
A Bitcoin spot ETF holds actual Bitcoin. When investors buy ETF shares, the issuer purchases Bitcoin on the open market, creating demand. When investors sell, the issuer may sell Bitcoin, creating supply pressure. Daily flow data is published and closely tracked.
Is this financial advice?
No. This article is an educational explainer only. EskiSignal does not give financial advice or cryptocurrency trading recommendations.
Sources checked: BlackRock IBIT product page (blackrock.com), Fidelity FBTC product page (fidelity.com), Coinglass (coinglass.com), Glassnode (glassnode.com), Federal Reserve (federalreserve.gov).