
EskiSignal
Daily and weekly market coverage focused on what changed, why it matters, and which signals are moving across stocks, sectors, volatility, sentiment, and rotation. Educational market analysis only, not investment advice.
Trends & Regimes
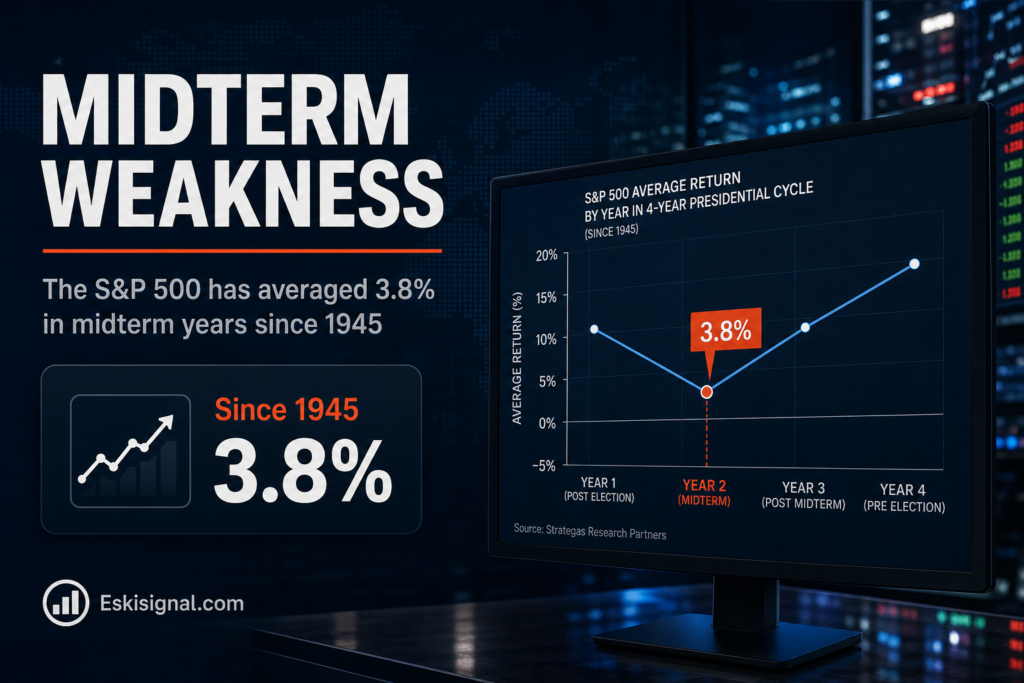
Midterm Years Are the Weakest Year of the Cycle: The Data Before November 3
Americans vote on 3 November. The statistic that will be quoted at every point between now and then is that...

Trends & Regimes
Equal Weight vs Cap Weight: What RSP Tells You That SPY Does Not
RSP and SPY hold the same 500 companies. Over the past decade they have delivered materially different returns, taken different...

Sectors & Rotation
Utilities and Energy Are Leading: How to Read a Defensive Rotation
Utilities and energy leading a market is the textbook signature of a late-cycle economy. It is also, in 2026, potentially...

Volatility & Sentiment
Put/Call Ratio and Skew: Sentiment Signals the VIX Does Not Capture
The VIX tells you how much movement the options market expects. It does not tell you which direction traders are...

Volatility & Sentiment
0DTE Options: How Same-Day Expiry Reshaped the Trading Session
Options that expire the same day they are traded now account for a majority of S&P 500 index option volume....

Trends & Regimes
Market Breadth Is Narrowing While Indexes Sit Near Records
An index can rise while most of its members fall. When that happens for long enough, analysts start using the...
Trends & Regimes
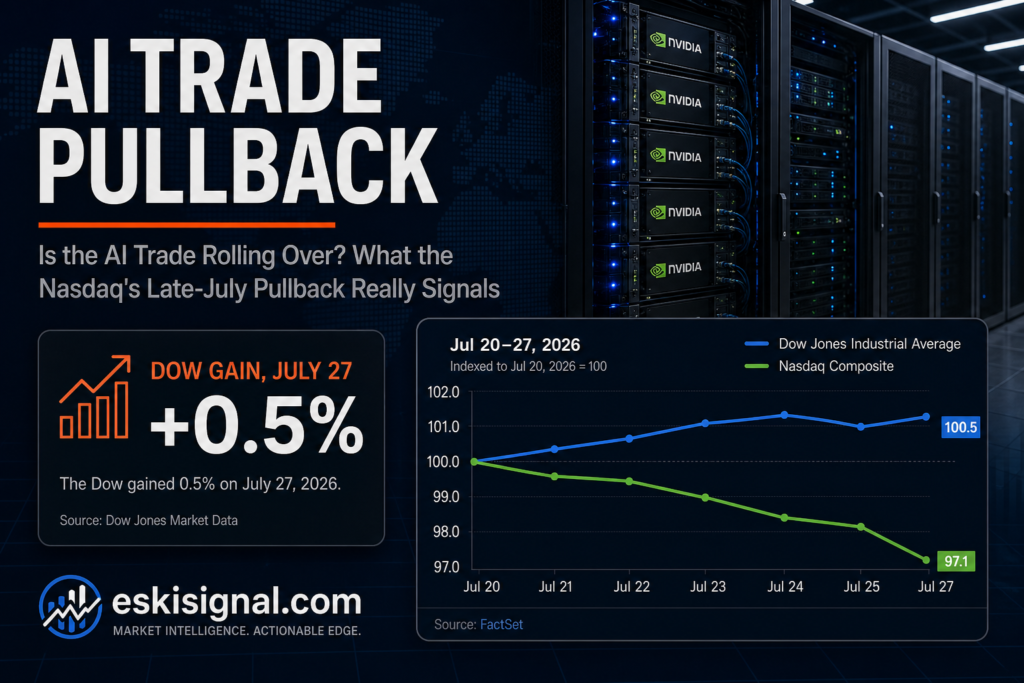
Is the AI Trade Rolling Over? What the Nasdaq’s Late-July Pullback Really Signals
Nvidia and other AI leaders wobbled as investors questioned the return on massive capex — how to tell a healthy rotation from the start of a bigger regime change.
Sectors & Rotation
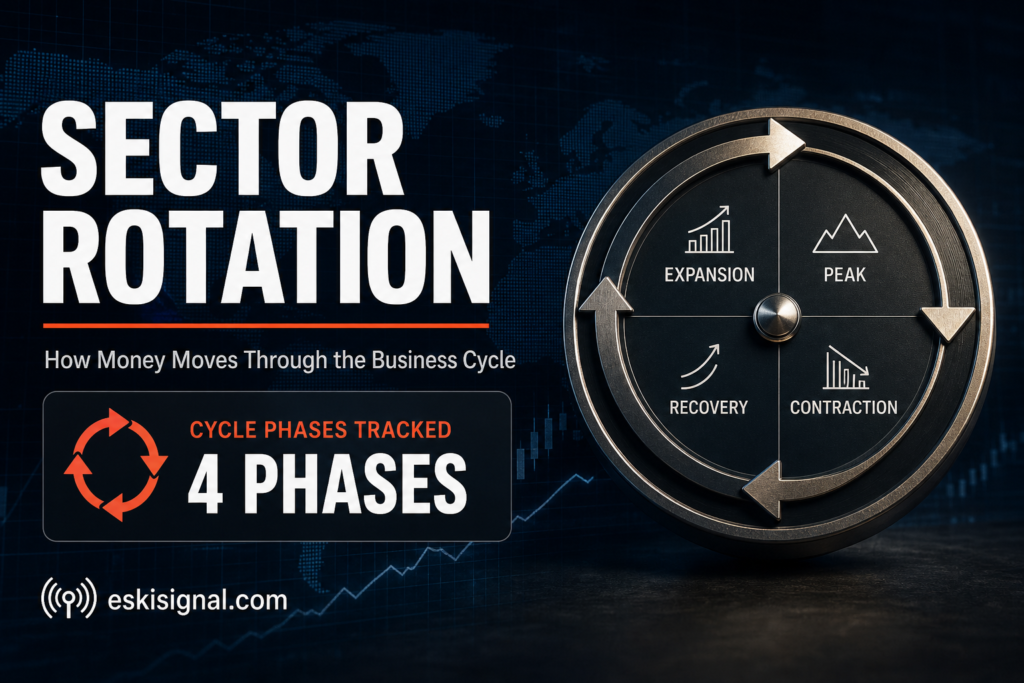
What Is Sector Rotation? How Money Moves Between Growth, Value, and Defensive Stocks
The S&P 500 can trade flat for a month while underneath the surface, money is violently reshuffling — utilities and...
Volatility & Sentiment
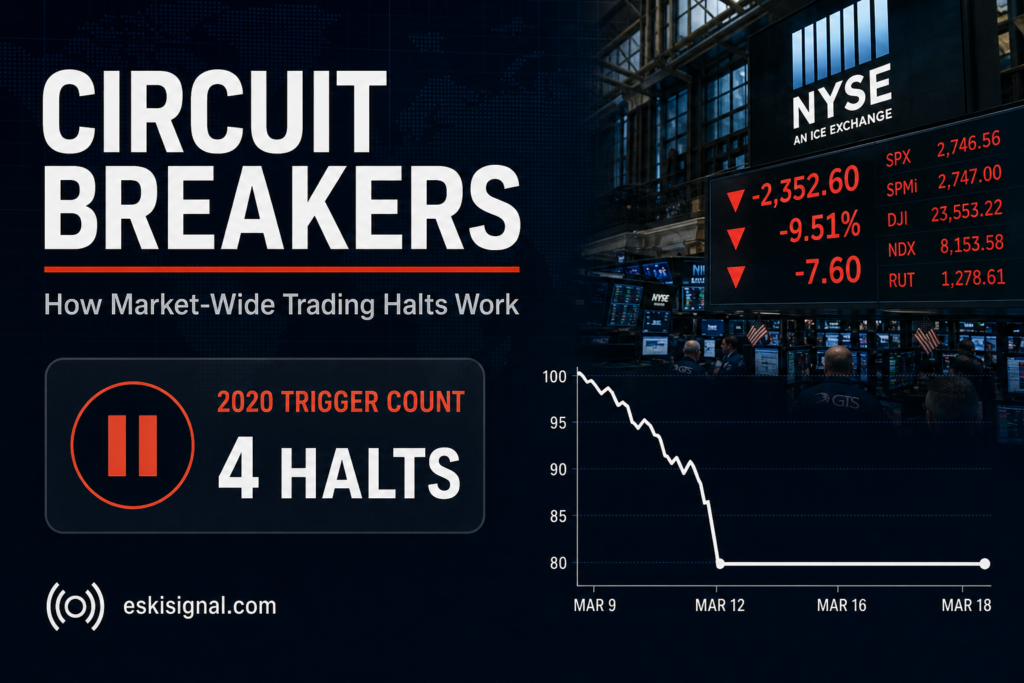
What Is a Circuit Breaker in Stock Trading? How Market-Wide Trading Halts Work
On March 16, 2020, the S&P 500 opened so far below the previous day’s close that exchanges froze trading nationwide...
Volatility & Sentiment
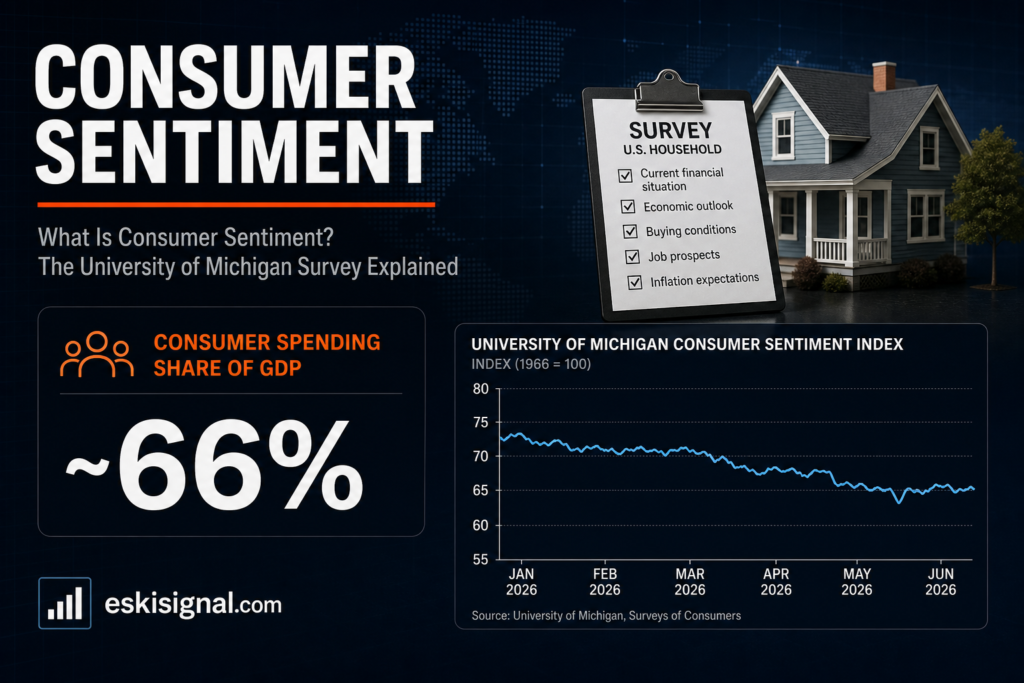
What Is Consumer Sentiment? The University of Michigan Survey Explained
Consumer sentiment gauges how people feel about the economy, and July 2026's readings are being reshaped by an energy-driven inflation shock.




