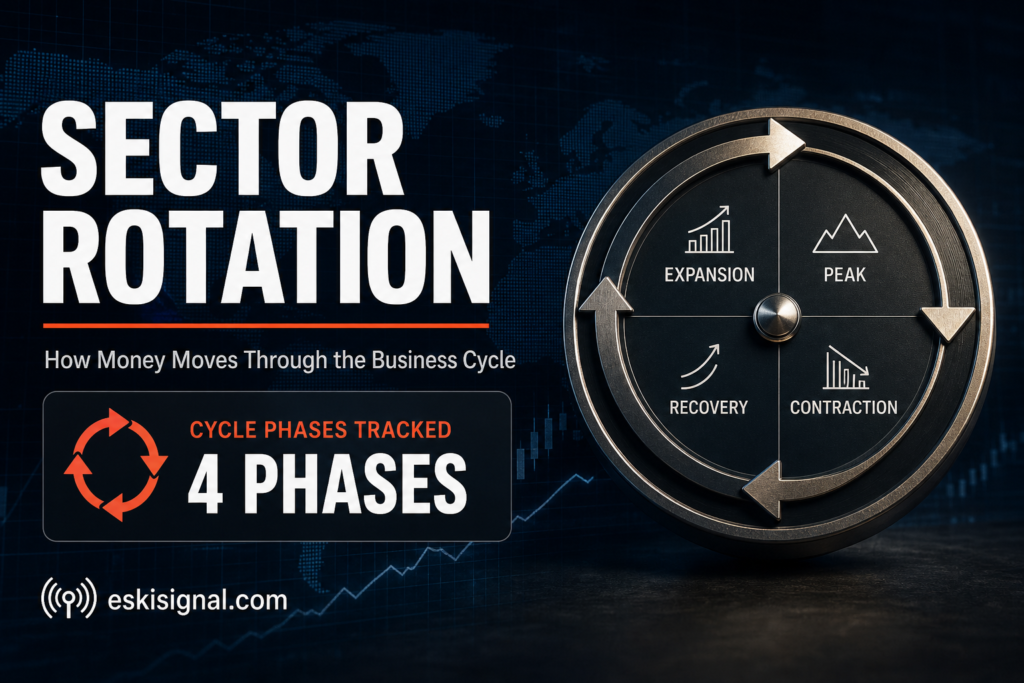
The S&P 500 can trade flat for a month while underneath the surface, money is violently reshuffling — utilities and staples rallying while tech and discretionary names bleed, or the reverse. That reshuffling has a name, a repeatable logic tied to the business cycle, and a reason professional allocators watch it more closely than the index level itself.
This article is for informational and educational purposes only. It is not financial advice, investment advice, or a recommendation to buy, sell, or hold any security, cryptocurrency, or financial product. Always verify data with official sources before making financial decisions.
Quick answer: what is sector rotation?
Quick answer: Sector rotation is the pattern of investors shifting capital between market sectors — such as technology, financials, utilities, and consumer staples — as expectations change about where the economy sits in its cycle. The core idea is that different sectors historically perform best at different points in the business cycle: cyclical sectors (like technology, discretionary, and industrials) tend to lead during expansion, while defensive sectors (like utilities, staples, and healthcare) tend to hold up better during slowdowns or contractions. Rotation is visible in relative sector performance even when the broad index barely moves.
The business cycle framework behind rotation
The classic sector-rotation model maps sectors against four broad phases of the business cycle: early expansion, late expansion, early contraction, and late contraction (recovery). It’s a simplification of a much messier reality, but it’s the mental model most professional allocators reference when discussing rotation.
| Cycle phase | Typically favored sectors | Why |
|---|---|---|
| Early expansion | Consumer discretionary, industrials, small caps | Growth accelerating, credit easing, risk appetite rising |
| Late expansion | Technology, communication services, energy | Growth peaking, inflation pressures building |
| Early contraction (slowdown) | Healthcare, consumer staples, utilities | Demand for defensive, non-cyclical earnings rises |
| Late contraction (recovery setup) | Financials, real estate, small caps | Rate cuts anticipated, risk appetite starts rebuilding |
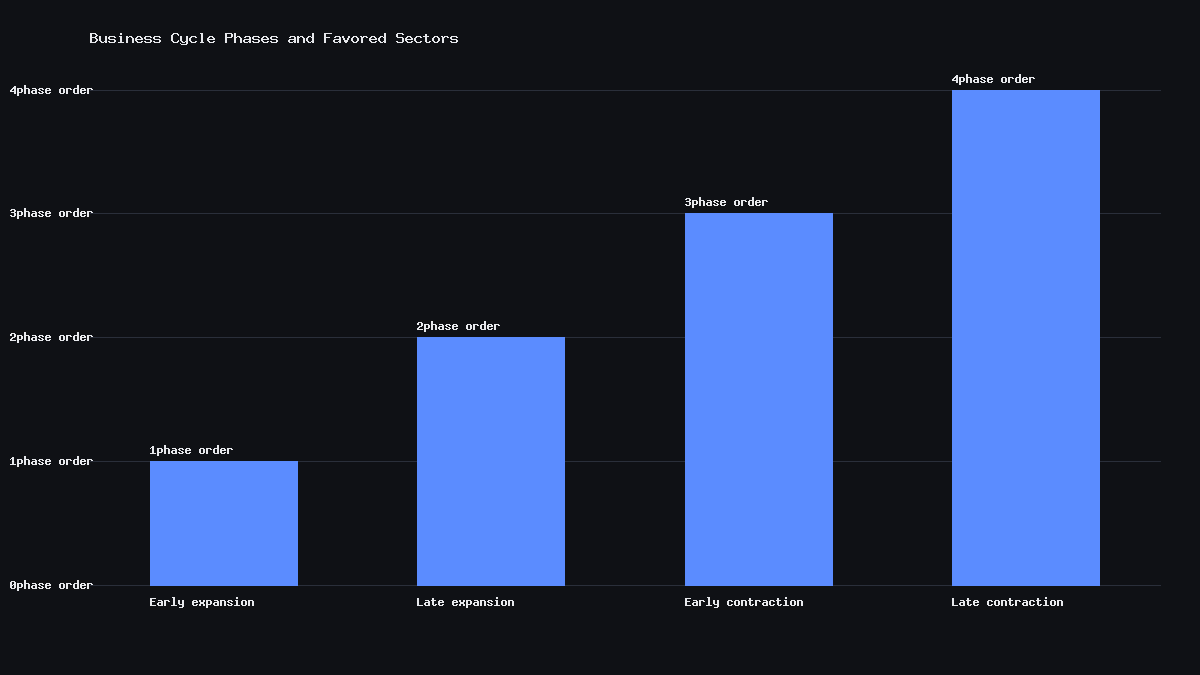
The framework is directional, not a precise timing tool — sectors don’t rotate on a fixed schedule, and overlapping crosscurrents (a rate cycle, a commodity shock, an AI capex boom) can override the “textbook” pattern for extended periods. It’s best treated as a lens for interpreting relative performance after the fact, rather than a rulebook for predicting it in advance.
Cyclical vs defensive: the core distinction
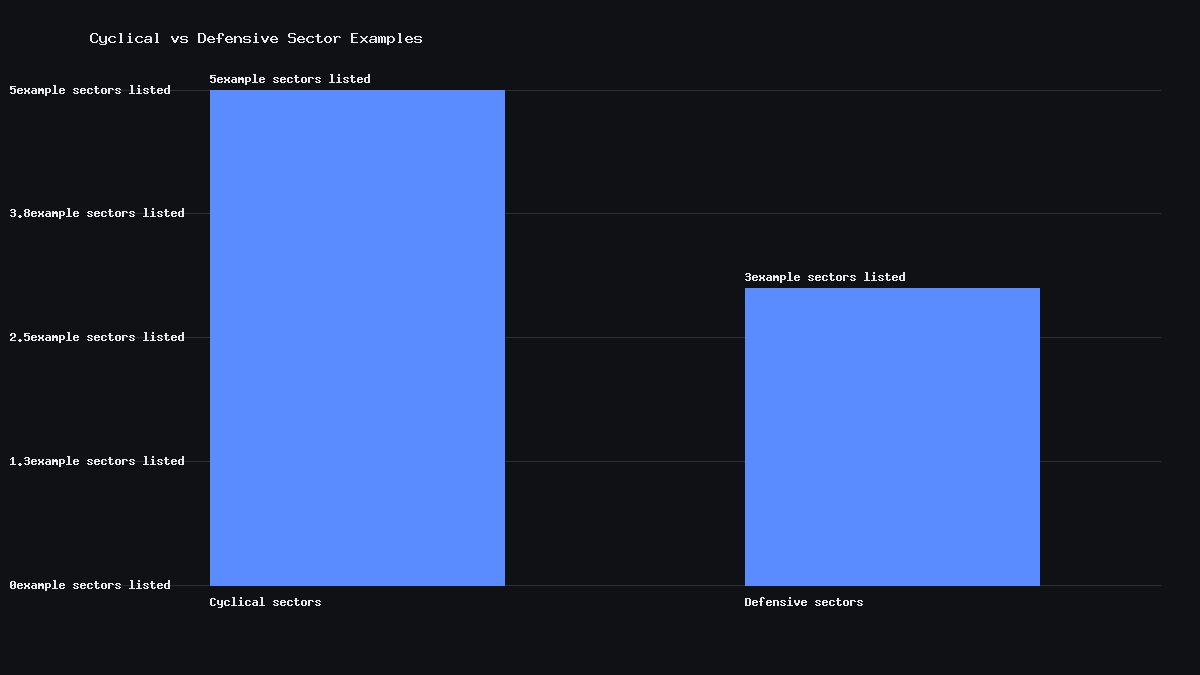
Underneath the four-phase framework is a simpler, more durable distinction: cyclical sectors have earnings that swing with the broader economy, while defensive sectors have earnings that stay relatively stable regardless of the cycle.
| Type | Example sectors | Earnings behavior |
|---|---|---|
| Cyclical | Technology, consumer discretionary, industrials, financials, materials | Rise and fall with economic growth and consumer spending |
| Defensive | Utilities, consumer staples, healthcare | Relatively stable — people still need electricity, food, and medicine in a downturn |
This is why utilities and staples are often called “safe havens” during market stress — not because they’re immune to selling, but because their underlying earnings are far less sensitive to a slowdown, which tends to make them relatively more resilient than cyclical sectors when growth expectations sour.
How rotation shows up in real market data
The clearest way to see rotation isn’t by watching the S&P 500’s level — it’s by comparing sector ETF performance against each other over the same window. If technology (via a fund like XLK) is sharply outperforming utilities (via XLU) over a stretch, that’s a cyclical, risk-on rotation; if the reverse is happening even while the index is flat or rising, it can be an early signal that investors are quietly de-risking underneath a calm-looking headline number. Fund flow data — which sector ETFs are seeing net inflows versus outflows — is one of the more direct ways professional allocators track rotation in real time, rather than waiting for a full cycle to play out and confirm the pattern in hindsight.
Risks and limits
- The business-cycle rotation framework is a simplified model — sectors don’t rotate on a fixed timetable, and other forces (rate cycles, commodity shocks, technology booms) can override it for years at a time.
- Sector classifications are broad; individual companies within a sector can behave very differently from their sector’s typical pattern.
- Rotation is usually easier to identify in hindsight than to predict in advance.
- This is educational content describing historical sector-cycle patterns — it is not a forecast or trading recommendation.
Mini glossary
| Term | Plain-English meaning |
|---|---|
| Cyclical sector | A sector whose earnings rise and fall closely with the broader economy |
| Defensive sector | A sector with earnings that stay relatively stable regardless of the economic cycle |
| Sector rotation | The shift of investor capital between sectors as cycle expectations change |
| Relative performance | How one sector or stock performs compared to another, independent of the broad index |
What are defensive sectors?
Defensive sectors — typically utilities, consumer staples, and healthcare — have earnings that stay relatively stable regardless of the economic cycle, since demand for electricity, groceries, and medicine doesn’t fluctuate much with the economy. They tend to hold up better than cyclical sectors during slowdowns.
Does sector rotation follow a fixed schedule?
No. The business-cycle rotation framework describes a typical pattern, but rotation doesn’t happen on a fixed timetable. Overlapping factors like interest-rate cycles, commodity price shocks, or major technology trends can extend, shorten, or override the textbook pattern.
How do investors track sector rotation in real time?
Common methods include comparing relative performance between sector ETFs, monitoring sector ETF fund flows for net inflows or outflows, and watching which sectors lead or lag the broad index over multi-week windows.
Sources
- Sector classification and historical cyclical/defensive performance data (GICS sector framework).
- Public fund-flow data on sector ETF inflows and outflows.
- Academic and industry research on business-cycle sector rotation models.