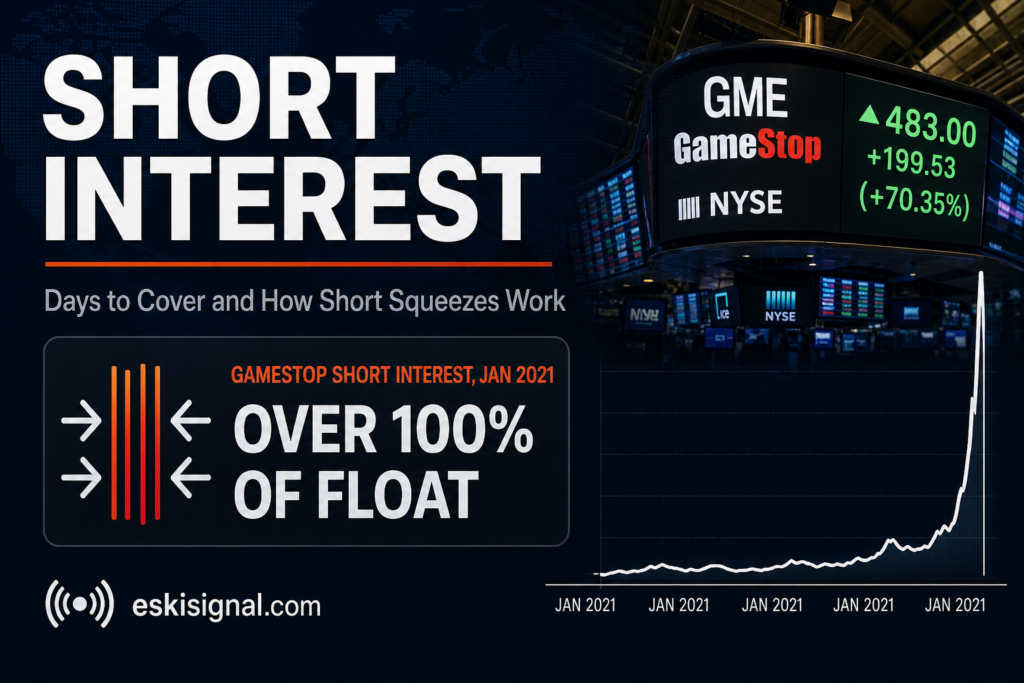
In January 2021, a heavily shorted video-game retailer became the center of a market event so violent that some hedge funds lost billions in days and Congress held hearings about it. What actually happened wasn’t magic — it was a mechanical consequence of a number most investors never check: short interest, and how many days it would take to cover it.
This article is for informational and educational purposes only. It is not financial advice, investment advice, or a recommendation to buy, sell, or hold any security, cryptocurrency, or financial product. Always verify data with official sources before making financial decisions.
Quick answer: what is short interest and days to cover?
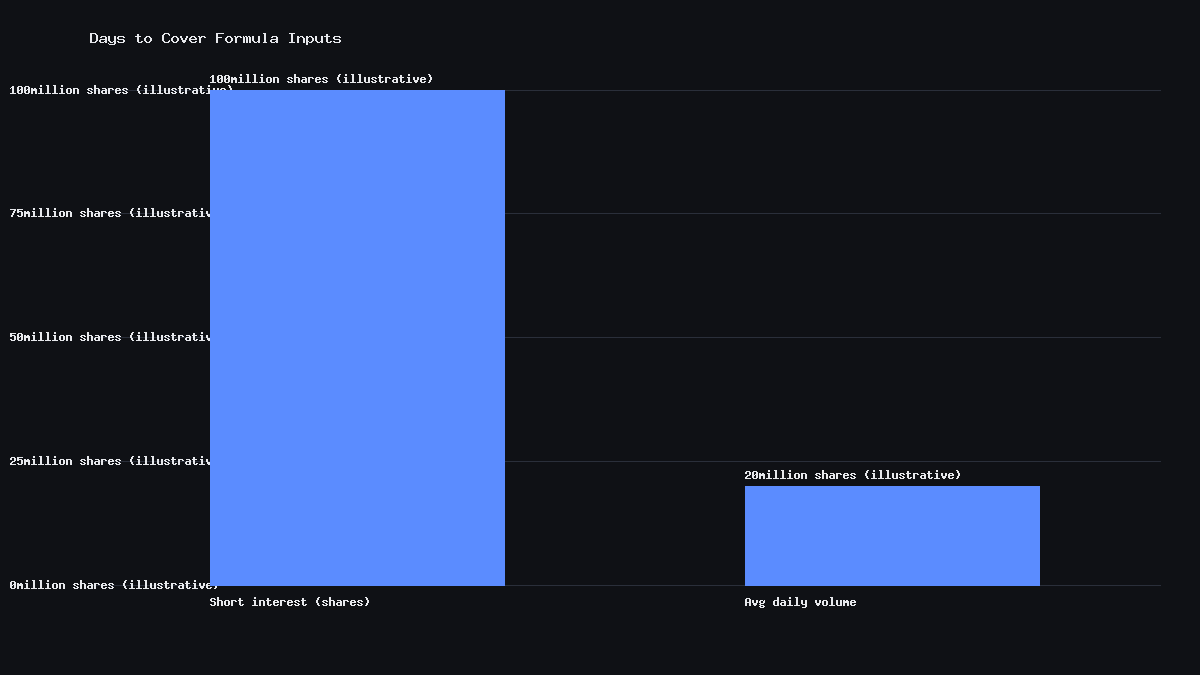
Quick answer: Short interest is the total number of a stock’s shares that have been sold short and not yet closed out (bought back or covered). It’s usually expressed as a raw share count or as a percentage of float — the shares actually available for public trading. Days to cover (also called the short-interest ratio) divides short interest by the stock’s average daily trading volume, estimating how many trading days it would take for all short sellers to buy back their positions at normal volume. High short interest combined with a high days-to-cover ratio is the setup that makes a short squeeze mechanically possible — though it doesn’t guarantee one will happen.
How short interest is measured and reported
In the US, FINRA requires member firms to report short-interest positions twice a month, and the aggregated data is published with a lag — meaning the short interest figure you see is typically settlement-date data from roughly a week or more before the publication date, not a live number. That lag is a critical detail: a stock’s short interest can change meaningfully between the reporting date and when the public sees the figure, especially during a fast-moving squeeze.
| Metric | What it measures | How it’s calculated |
|---|---|---|
| Short interest (shares) | Total shares currently sold short and not covered | Reported by brokers to FINRA |
| Short interest (% of float) | Short interest relative to shares available for trading | Short interest ÷ float |
| Days to cover | Estimated trading days needed to close all short positions | Short interest ÷ average daily volume |
How a short squeeze mechanically happens
Short selling involves borrowing shares and selling them, with an obligation to buy them back later to return to the lender. If the stock price rises instead of falling as the short seller expected, the short position loses money — and unlike a long position, that loss is theoretically unlimited, since a stock’s price has no ceiling. As losses mount, short sellers (or their brokers, via margin calls) are forced to buy back shares to close the position and cap the loss. That forced buying adds new demand on top of whatever pushed the price up in the first place, which can drive the price higher still, forcing more shorts to cover — a self-reinforcing loop.
The ingredients that make a squeeze mechanically possible are specific: high short interest as a percentage of float (so there’s a large pool of forced buyers), a high days-to-cover ratio (so that pool can’t unwind quickly without moving the price), and a catalyst — a positive surprise, a coordinated buying push, or simply a low-float stock where even modest buying moves the price sharply.
A real-world example: GameStop, January 2021
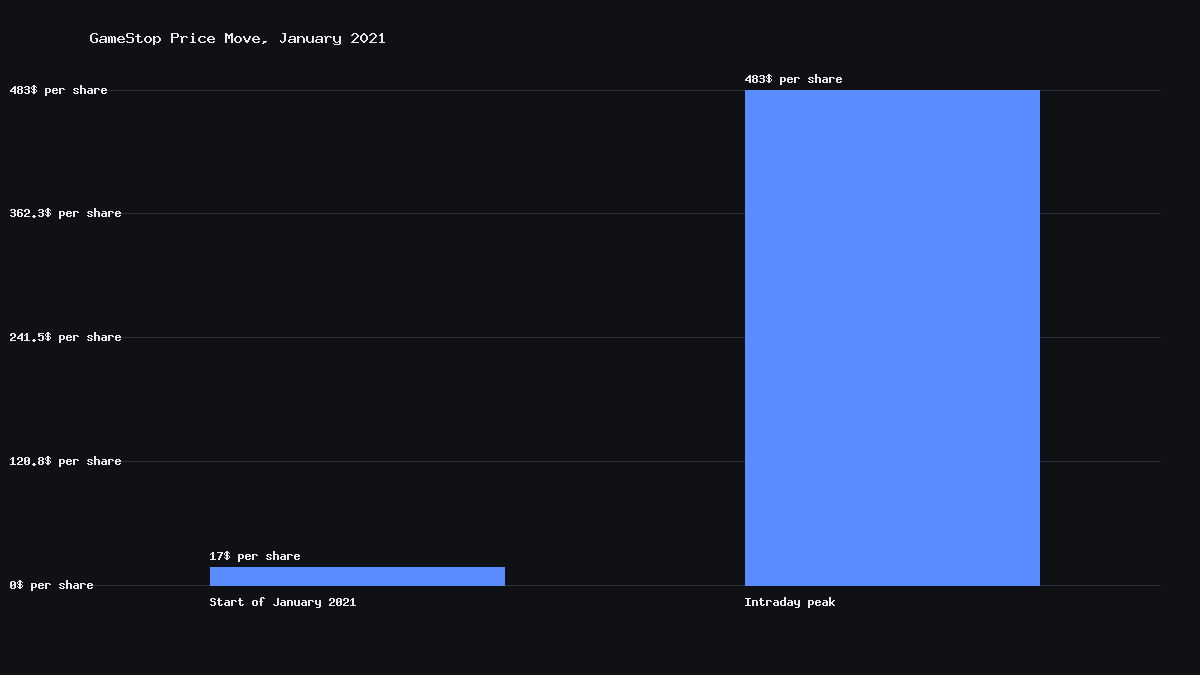
GameStop entered January 2021 with short interest reported at well over 100% of its public float — a figure only possible because shares can be borrowed and re-shorted multiple times through securities lending. With that much of the tradable float already sold short, and a days-to-cover ratio stretched out over multiple trading sessions at normal volume, coordinated retail buying (organized largely through the Reddit forum r/WallStreetBets) provided the catalyst. As the price climbed, funds with large short positions faced mounting losses and were forced to cover, adding fuel to the rally — the stock moved from single digits to an intraday high near $483 within a few weeks, before falling back sharply as the squeeze unwound.
Short interest vs unusual volume: different signals
It’s worth separating short interest from unusual trading volume, since both get cited in squeeze discussions but measure different things. Short interest is a positioning metric — how many shares are currently sold short, updated only twice monthly. Unusual volume is an activity metric — how much a stock is trading right now versus its normal average, updated continuously. A stock can have high short interest with completely normal volume for months, and then see volume spike suddenly when a catalyst hits; watching both together gives a fuller picture than either alone.
Risks and limits
- Short interest data is reported twice monthly and published with a lag, so it does not reflect real-time positioning.
- High short interest and a high days-to-cover ratio make a squeeze mechanically possible, but they do not predict whether or when one will occur.
- Short squeezes can reverse as sharply as they rally once the forced-covering pressure is exhausted, leaving late buyers exposed to steep losses.
- This is educational content describing short-selling and squeeze mechanics — it is not a signal, prediction, or trading strategy.
Mini glossary
| Term | Plain-English meaning |
|---|---|
| Short interest | Total shares currently sold short and not yet covered |
| Days to cover | Estimated trading days needed to buy back all short positions at average volume |
| Float | Shares of a company actually available for public trading |
| Short squeeze | A rapid price rise forcing short sellers to buy back shares, adding further upward pressure |
How often is short interest data updated?
In the US, FINRA requires member firms to report short-interest positions twice a month, and the aggregated figures are published with a settlement lag, so the numbers investors see are typically at least several days to a week old.
Can short interest be over 100% of a stock’s float?
Yes. Because borrowed shares can be re-lent and shorted again through securities lending chains, reported short interest can technically exceed 100% of a stock’s float, as was the case with GameStop in January 2021.
Does high short interest guarantee a short squeeze?
No. High short interest and a high days-to-cover ratio create the mechanical conditions that make a squeeze possible, but a squeeze also requires a catalyst — such as a positive surprise or a sharp surge in buying volume — to actually force short sellers to cover.
Sources
- FINRA, short interest reporting requirements and publication schedule.
- SEC and public reporting on the January 2021 GameStop short squeeze.
- Public market data on short interest and trading volume methodology.