
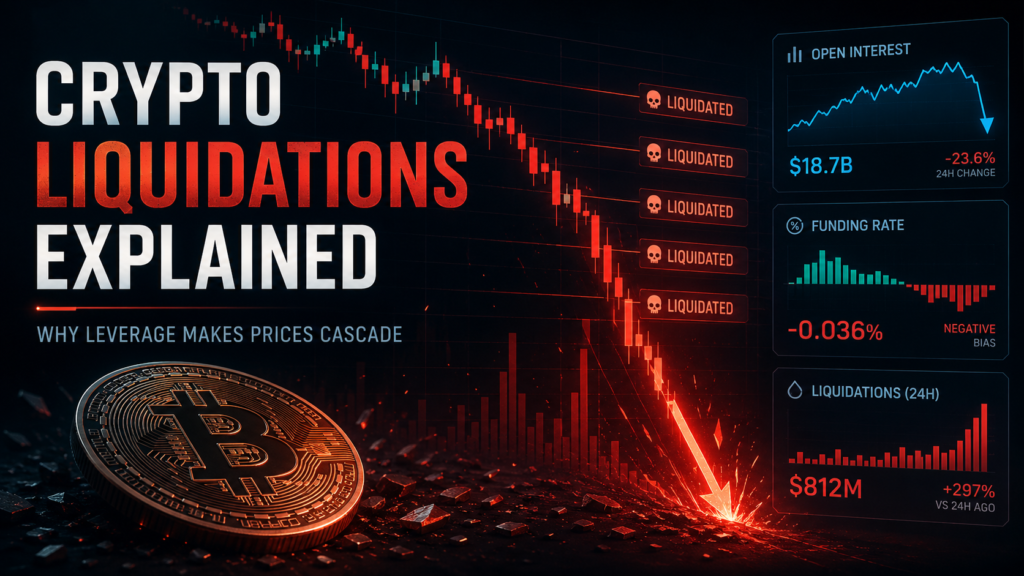
If you have ever watched Bitcoin drop several thousand dollars in a matter of minutes, you have probably seen a liquidation cascade in action. Liquidations are one of the main reasons crypto moves so violently compared with most traditional markets, and they come down to a single ingredient: leverage. This is a plain-English explainer of what liquidations are, why they cascade, and the derivatives data traders watch to gauge the risk. It is educational only — not trading advice, and not a strategy.
Informational and educational content only. Nothing here is financial or investment advice, or a recommendation to buy, sell, or hold anything. Verify figures against official sources before acting on them.
What a liquidation actually is
When you trade with leverage, you borrow to control a position larger than your own collateral. The exchange sets a maintenance margin — a minimum equity level for keeping the position open. If the market moves against you far enough that your equity falls below that threshold, the exchange forcibly closes the position to stop the loss from going further. That forced close is a liquidation. For a leveraged long, it triggers when the price falls to your liquidation price; for a short, when the price rises to it.
The higher the leverage, the smaller the move needed to wipe out the collateral. A position at 20x leverage can be liquidated by roughly a 5% adverse move, while a 2x position has far more room. That is the core reason high leverage is fragile.
Why liquidations cascade
Here is where crypto’s structure amplifies things. When a liquidation fires, the exchange sells (for longs) or buys (for shorts) into the market to close the position. That order pushes the price further in the same direction, which can drag the next cluster of leveraged positions to their own liquidation prices, which triggers more forced selling, and so on. Stop-losses and automated strategies pile on. The result is a self-reinforcing loop: a “long squeeze” on the way down, or a “short squeeze” on the way up.
A concrete example: in past episodes, Bitcoin has fallen thousands of dollars in hours as several hundred million dollars in leveraged longs were force-closed across exchanges, most of them in the 10x–20x range. The initial drop did not need a dramatic news catalyst — the leverage did the work once the first liquidations started firing.
The three data points traders watch
Because liquidations come from leverage, the derivatives market gives early-warning signals about how much leverage is built up and which side is crowded. Three metrics do most of the work:
| Metric | What it measures | What extremes can hint at |
|---|---|---|
| Open interest (OI) | Total outstanding futures contracts | High OI = a lot of leverage in the system |
| Funding rate | Periodic payment between longs and shorts on perpetuals | Very positive = crowded longs; very negative = crowded shorts |
| Liquidation data | Size and side of forced closes | Where leverage is being flushed |
Read together, they are more useful than any one alone. High open interest paired with an extreme funding rate often signals crowded, one-sided positioning — the setup that precedes a squeeze. When open interest suddenly collapses during a sharp price move, that is usually leverage being forcibly unwound rather than calm profit-taking.
A quick word on funding rates
On perpetual futures, which have no expiry, the funding rate is the mechanism that keeps the contract price tethered to spot. When longs dominate, they pay shorts; when shorts dominate, they pay longs. A persistently high positive funding rate tells you longs are crowded and paying up to stay in — a condition that can leave the market vulnerable to a downside flush if price stalls. Some traders are liquidated not by a big price move at all, but by funding fees bleeding their margin over time.
The risk, stated plainly
Liquidation cascades are a structural feature of leveraged crypto markets, not a glitch. They can create violent moves in both directions and are very hard to time. The mechanics described here explain why the moves happen; they are not a signal to trade them. Common risk-reduction ideas that get discussed — lower leverage, extra collateral, position sizing — are mechanics points, and how anyone applies them depends on their own situation, which this article cannot assess.
What is a liquidation in crypto?
It is the forced closure of a leveraged position by an exchange when the trader’s equity falls below the maintenance margin. For a long, it triggers when the price falls to the liquidation price; for a short, when the price rises to it.
Why do liquidations cause cascades?
Each forced close sells or buys into the market, pushing the price further in the same direction and dragging the next cluster of leveraged positions to their liquidation prices. Stop-losses and bots amplify the loop.
What is a funding rate?
On perpetual futures, the funding rate is a periodic payment between longs and shorts that keeps the contract price near spot. A high positive rate signals crowded longs; a negative rate signals crowded shorts.
How do traders see liquidation risk building?
By watching open interest, funding rates, and liquidation data together. High open interest with extreme funding often signals crowded, fragile positioning. This is descriptive, not a trading signal.
Sources
- Exchange and analytics references (CoinGlass, Coinalyze) on open interest, funding, and liquidations.
- Educational explainers on perpetual futures mechanics and margin.
- Reporting on historical Bitcoin liquidation events.





