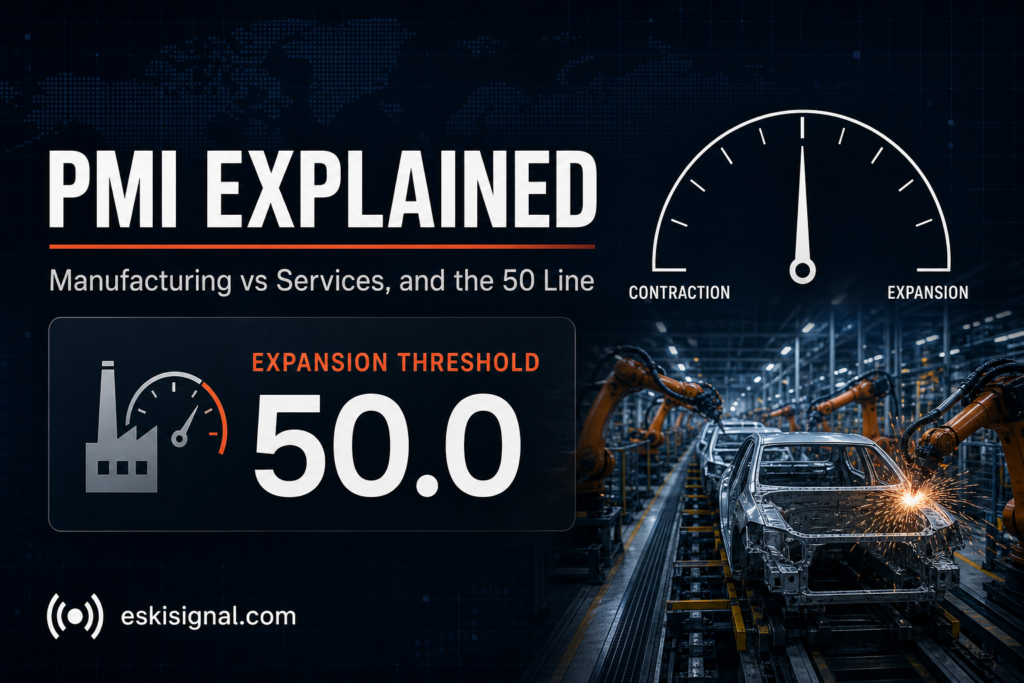
A single number released on the first business day of every month can move bond yields, the dollar, and equity futures before most traders have finished their coffee. It’s not a government report and it’s not GDP — it’s a survey of purchasing managers, and the entire signal hinges on one threshold: 50.
This article is for informational and educational purposes only. It is not financial advice, investment advice, or a recommendation to buy, sell, or hold any security, cryptocurrency, or financial product. Always verify data with official sources before making financial decisions.
Quick answer: what is the PMI?
Quick answer: The Purchasing Managers’ Index (PMI) is a monthly survey-based gauge of business activity, built by asking purchasing managers at hundreds of companies whether conditions — new orders, output, employment, supplier deliveries, inventories — improved, worsened, or stayed the same versus the prior month. A reading above 50 signals expansion; a reading below 50 signals contraction. In the US, two competing survey providers publish PMI-style data each month: the Institute for Supply Management (ISM) and S&P Global, and they don’t always agree, which is itself a useful signal about how mixed the underlying data is.
How the PMI is actually built
Unlike GDP or the jobs report, the PMI isn’t built from hard transaction or payroll data — it’s a diffusion index built from a survey. Purchasing managers at a panel of companies are asked whether each of several business conditions is better, worse, or the same as last month. The percentage saying “better” plus half the percentage saying “the same” produces the sub-index reading; a weighted blend of the sub-indexes (new orders, production, employment, supplier deliveries, and inventories, in the ISM’s case) produces the headline number.
| PMI reading | What it signals |
|---|---|
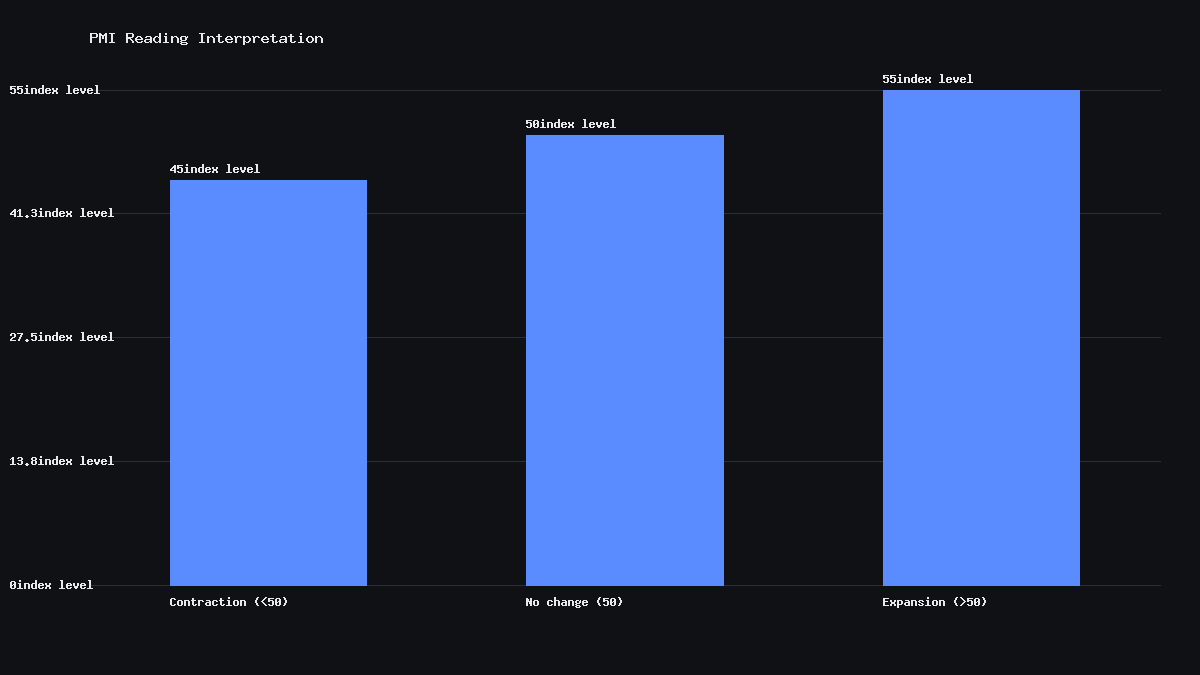
| Above 50 | Sector is expanding versus the prior month |
| Exactly 50 | No change versus the prior month |
| Below 50 | Sector is contracting versus the prior month |
| Below ~42 (ISM Manufacturing, historically) | Has historically coincided with broader economic recession, though not a hard rule |
Because it’s a diffusion index, the PMI says nothing about the magnitude of change — a reading of 52 doesn’t mean activity grew by “2%,” it means a modest majority of survey respondents reported improvement. That distinction matters: a PMI can stay above 50 for months while actual output growth slows sharply, because the index is measuring the breadth of improvement, not its size.
Manufacturing PMI vs Services PMI
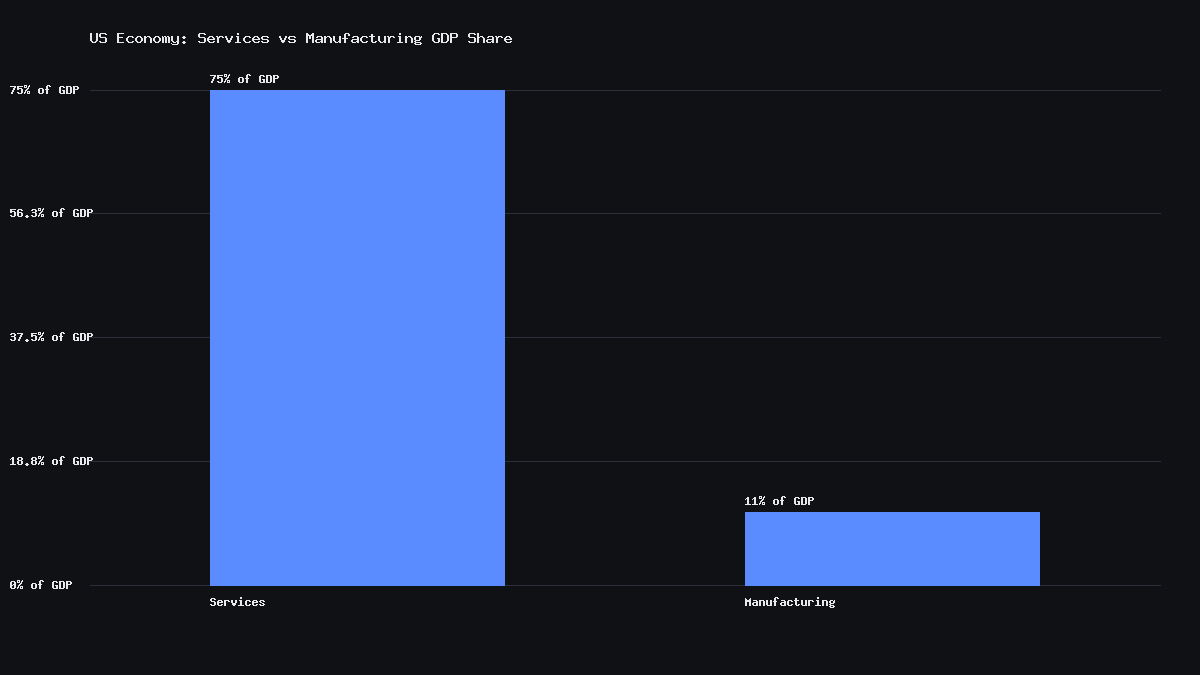
The US publishes separate PMI readings for manufacturing and services, and they frequently diverge. Manufacturing directly represents a much smaller share of US GDP than services does — services make up roughly three-quarters of US economic output — so the Services PMI is often treated as the more representative gauge of the broader economy, even though Manufacturing PMI tends to get more headline attention because industrial activity is more sensitive to global trade and inventory cycles.
| Feature | Manufacturing PMI | Services PMI |
|---|---|---|
| Share of US economy represented | Smaller (~11% of GDP) | Larger (~75%+ of GDP) |
| Sensitivity | Global trade, inventories, industrial cycles | Consumer demand, labor costs, domestic spending |
| Typical volatility | More volatile, swings faster with trade/tariff news | Generally steadier, moves with broader consumer trends |
ISM vs S&P Global: why the two US PMIs disagree
A recurring source of confusion is that the US has two separate, independently run PMI-style surveys — the ISM (Institute for Supply Management) Manufacturing and Services indexes, and the S&P Global US Manufacturing and Services PMI. They survey different, overlapping panels of companies using different methodologies, and it’s common for one to show expansion (above 50) while the other shows contraction in the same month. When that split happens, it’s often a sign the underlying economic picture is genuinely mixed rather than a data error in either survey — one may be weighted more toward large industrial firms, the other toward a broader sample including smaller businesses.
Why the PMI moves markets faster than GDP
The PMI is released on the first business day of the following month, far sooner than GDP, which arrives roughly a month after each quarter ends. That speed is exactly why traders lean on it as a real-time read on the economy between GDP releases — it’s often called a “leading indicator” because survey-based sentiment about new orders and hiring plans tends to shift before it shows up in hard output or payroll data. A PMI print that crosses the 50 line in either direction, especially by a wide margin versus the prior month, can move Treasury yields and rate-cut expectations within minutes of release.
Risks and limits
- The PMI is a diffusion index measuring the breadth of change, not its magnitude — a small majority reporting “improvement” produces the same directional signal as an overwhelming one.
- Survey-based data can shift with respondent sentiment even when hard output data hasn’t moved yet, which occasionally leads to false signals.
- The ISM and S&P Global versions can disagree in the same month, so relying on a single provider’s headline number without checking the other can be misleading.
- This is educational content describing how PMI surveys work — it is not a forecast of future economic conditions.
Mini glossary
| Term | Plain-English meaning |
|---|---|
| Diffusion index | An index measuring the breadth of respondents reporting improvement vs decline |
| ISM | Institute for Supply Management, publisher of one of the two major US PMI surveys |
| Sub-index | A component reading (e.g., new orders, employment) that feeds into the headline PMI |
| Leading indicator | A data series that tends to shift before broader economic activity does |
What does a PMI reading above 50 mean?
A PMI reading above 50 means more purchasing managers reported improving conditions than declining ones compared to the prior month, signaling expansion in that sector. It does not indicate how large the improvement was, only that more respondents saw growth than contraction.
Why do ISM and S&P Global PMI numbers sometimes differ?
The two surveys use different company panels and methodologies. It’s common for them to show different directional signals in the same month, which often reflects a genuinely mixed economic picture rather than an error in either survey.
Is Manufacturing PMI or Services PMI more important?
Services PMI arguably better represents the broader US economy since services make up roughly three-quarters of GDP, while manufacturing is a smaller share. However, Manufacturing PMI tends to be more volatile and sensitive to global trade conditions, which is why it often draws more market attention despite its smaller economic footprint.
How often is the PMI released?
PMI data is released monthly, typically with preliminary “flash” estimates released near the end of the current month and final readings published on the first business day of the following month.
Sources
- Institute for Supply Management (ISM), Manufacturing and Services Report on Business methodology.
- S&P Global, US PMI survey methodology and historical data.
- US Bureau of Economic Analysis, sector shares of US GDP.