Every month, before shoppers ever see a price tag change, something has already shifted further back in the supply chain. That’s the territory the Producer Price Index covers — the prices businesses charge each other, before goods and services reach the checkout counter. It’s less famous than the Consumer Price Index, but for anyone trying to spot inflation before it shows up in a grocery receipt, the PPI is often the earlier signal.
This article is for informational and educational purposes only. It is not financial advice, investment advice, or a recommendation to buy, sell, or hold any security, cryptocurrency, or financial product. Always verify data with official sources before making financial decisions.
Short answer — what the Producer Price Index measures
The Producer Price Index, or PPI, tracks the average change over time in the prices producers receive for their goods and services. It’s published monthly by the U.S. Bureau of Labor Statistics and covers thousands of industries — everything from steel mills and chicken farms to freight companies and software firms. In plain terms, the PPI answers a simple question: are businesses charging more or less to sell what they make, before it ever reaches a store shelf or a consumer’s inbox?
That distinction matters. The PPI isn’t measuring what households pay. It’s measuring what happens one or more steps earlier — at the factory gate, the wholesale warehouse, or the service provider’s invoice. Because those cost pressures often get passed along to consumers eventually, the PPI is widely read as an early hint of where consumer inflation might be headed, though the relationship isn’t perfectly mechanical.
PPI vs CPI at a glance
| Feature | PPI | CPI |
|---|---|---|
| Whose prices? | Sellers/producers | Consumers/households |
| Where in the chain? | Earlier — factory gate, wholesale, services output | Later — retail checkout |
| Published by | Bureau of Labor Statistics | Bureau of Labor Statistics |
| Main use | Early inflation-pressure signal, input-cost tracking | Headline inflation gauge, cost-of-living adjustments |
| Volatility | Often more volatile month to month | Somewhat smoother, more closely watched by the public |
Neither index is “better” — they’re measuring different points on the same supply chain. A useful way to think about it: PPI is closer to the source, CPI is closer to the sink. For a deeper look at how the two relate to a third gauge the Fed actually targets, see our explainer on PCE vs CPI.
How the PPI is built (final demand, intermediate demand, stages)
The PPI isn’t one single number — it’s a family of indexes organized around where a good or service sits in the production process.
- Final demand — prices for goods, services, and construction sold to end users (this is the headline PPI figure most news reports quote).
- Intermediate demand — prices for goods and services still moving through the production pipeline, like raw steel bought by an appliance maker.
- Stage-of-processing structure — an older but still-used framework that groups items into crude materials, intermediate goods, and finished goods, tracing a product from raw input to finished item.
Within final demand, the BLS further splits things into goods, services, and construction, and separates out food and energy — the same volatile categories that get stripped out to calculate “core” inflation elsewhere. Given how much oil prices moved in 2026 after the Iran conflict and Strait of Hormuz stress episode, that energy carve-out has been especially useful for separating a temporary shock from an underlying trend.
Why the PPI is called a “pipeline” indicator
Economists sometimes call the PPI a pipeline indicator because cost pressure tends to flow through it in stages, much like fluid moving through pipes of different diameters. A jump in crude materials prices doesn’t usually hit consumers overnight — it first shows up in intermediate goods, then in final demand prices charged by producers, and only later, if it shows up at all, in retail prices that consumers see.
That lag is neither fixed nor guaranteed. Sometimes producers absorb costs into thinner margins rather than passing them on. Sometimes competitive pressure or falling demand cuts the chain short. But when PPI readings run hot for several months in a row, it’s often treated as a signal worth watching, since it suggests cost pressure is building somewhere upstream of the checkout line.
A real-world example
Picture a furniture manufacturer. Lumber prices rise because of a supply disruption, and freight costs climb because diesel got more expensive during the 2026 oil-price spike. Those cost increases show up first in the PPI’s intermediate demand data — lumber and transportation services get more expensive for the manufacturer. A few months later, if the manufacturer can’t absorb the higher input costs, the finished-goods PPI for furniture rises too, since that’s the price the manufacturer charges retailers.
Only after that does the retailer typically decide whether to raise the shelf price, hold it steady and accept a thinner margin, or wait for costs to ease. That final decision is what eventually shows up in the CPI. The PPI captured the pressure building weeks or months before shoppers noticed anything different at the store.
Where the PPI shows up on EskiSignal
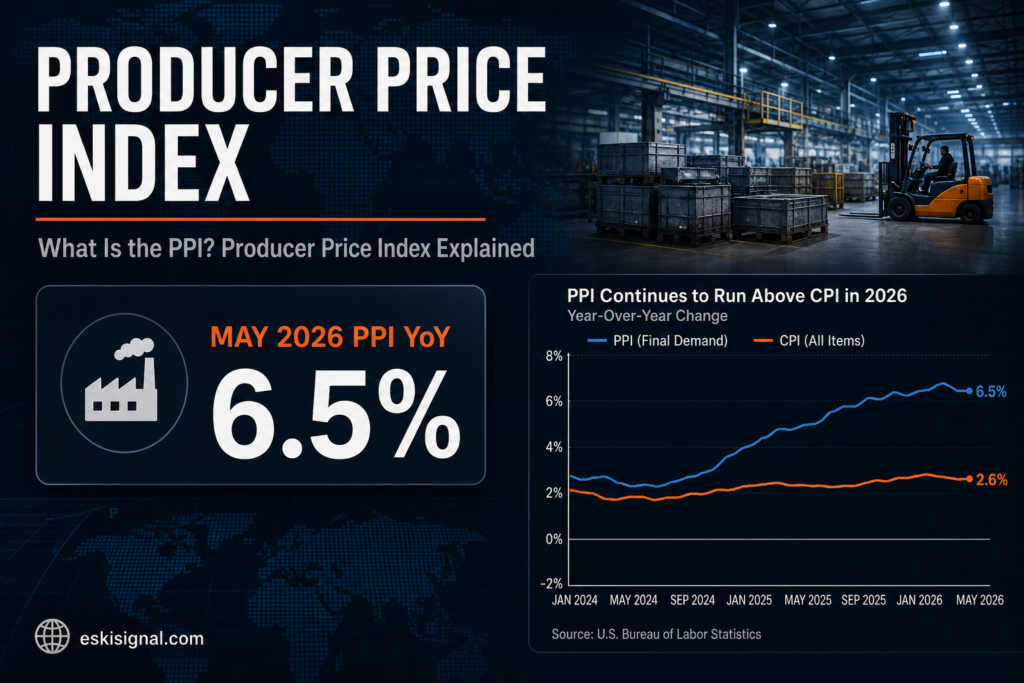
We cover the PPI release every month alongside CPI and jobs data, since all three feed into the same picture the Fed is watching. Our coverage of the May 2026 PPI report, for instance, showed wholesale inflation running at 6.5% — notably hotter than the 4.2% headline CPI figure from the same month, underscoring how much cost pressure was still sitting upstream in the pipeline even as consumer prices lagged behind.
Mini glossary
| Term | Plain-English meaning |
|---|---|
| Final demand | Prices for goods and services sold to the end buyer — the headline PPI number. |
| Intermediate demand | Prices for inputs still being processed further down the chain, like raw materials or wholesale components. |
| Core PPI | PPI with food and energy stripped out, meant to show underlying pressure without volatile swings. |
| Headline PPI | The all-items final demand number, including food and energy. |
| Month-over-month (MoM) | How much prices changed compared with the previous month. |
| Year-over-year (YoY) | How much prices changed compared with the same month a year earlier. |
Risks and limits of reading PPI
The PPI is genuinely useful, but it’s easy to over-read. A single hot or cool month can reflect a one-off event — a shipping disruption, a spike in a single commodity, a seasonal quirk — rather than a lasting trend. The 2026 energy shock is a good example: oil prices spiked sharply during the Iran conflict, pushed up energy-related PPI components, then began easing after the subsequent deal calmed the Strait of Hormuz situation. Reading that swing as a permanent shift in underlying inflation would have missed the point.
The PPI also gets revised after its initial release, sometimes meaningfully, as more complete data comes in. And because it’s a producer-side measure, it doesn’t always translate directly into consumer prices — margins, competition, and demand all sit between the two. Treat PPI moves as one input among several, not a standalone verdict on where prices are headed.
PPI vs CPI — what’s the real difference?
PPI measures prices at the producer or seller level, while CPI measures what consumers actually pay at the register. They often move in the same direction but rarely by the same amount, and PPI tends to move first since cost pressure usually starts upstream.
Who publishes the PPI?
The U.S. Bureau of Labor Statistics publishes the PPI monthly, using survey data collected from tens of thousands of businesses across manufacturing, services, construction, and agriculture.
Why do markets watch the PPI so closely?
Because it can hint at where consumer inflation is headed before CPI confirms it. With the Fed under Kevin Warsh already flagging a hawkish 2026 outlook and a higher core PCE projection, traders are paying close attention to any data — including PPI — that could shift expectations for future rate decisions.
When is the PPI released each month?
The BLS typically releases the PPI in the second week of each month, usually covering data from the prior month, and posts an exact schedule in advance on its website.
Sources
- U.S. Bureau of Labor Statistics — Producer Price Index news releases and methodology documentation.
- U.S. Bureau of Labor Statistics — Consumer Price Index news releases, for comparison with PPI.
- Federal Reserve — FOMC statements and economic projections referencing inflation gauges.
- EskiSignal — prior coverage of monthly CPI, PPI, and jobs reports.