September brings a rate decision with fresh projections, two full inflation reports, a jobs report, and quarterly expiry and rebalancing all in the same month. Here is the full calendar and what each release actually determines.
This article is for informational and educational purposes only. It is not financial advice, investment advice, or a recommendation to buy, sell, or hold any security, cryptocurrency, or financial product. Always verify data with official sources before making financial decisions.
The month at a glance
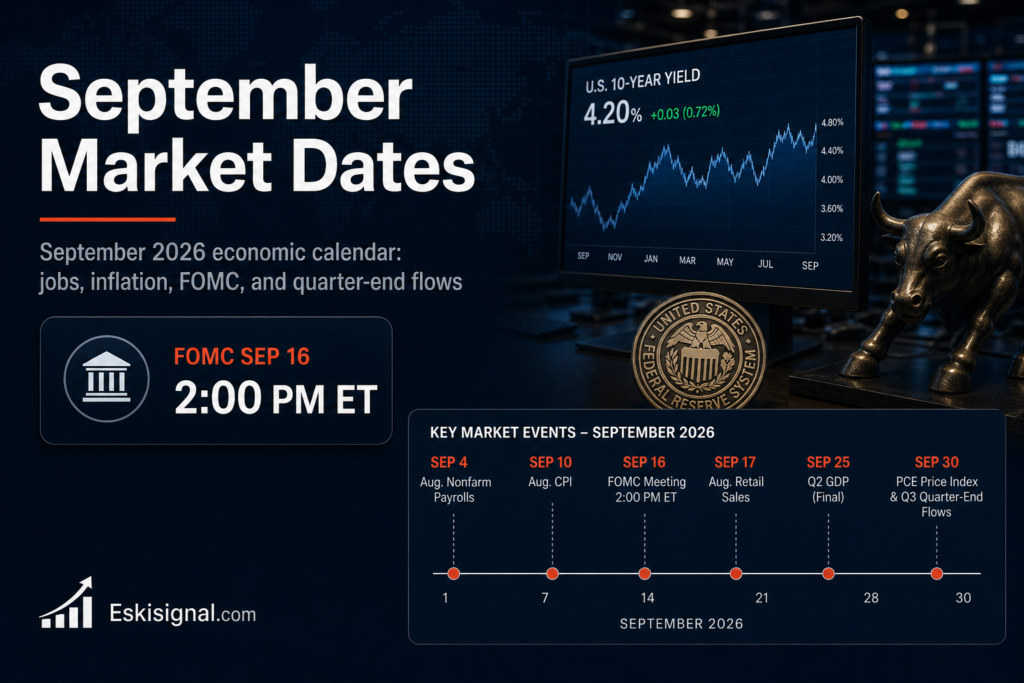
Short answer: The month opens with a holiday-shortened week, delivers the August jobs report in the first full week, CPI and PPI in the second, the FOMC decision with a Summary of Economic Projections on September 16, and closes with triple witching and quarter-end rebalancing. The FOMC meeting is the single largest event; the CPI print immediately before it is the largest data point.
| Period | Events |
|---|---|
| Week of Sep 7 | Labor Day holiday Monday; JOLTS; ADP; jobless claims; August jobs report |
| Week of Sep 14 | August CPI; August PPI; import prices; FOMC decision and projections Sep 16 |
| Week of Sep 21 | Existing home sales; flash PMIs; durable goods |
| Week of Sep 28 | PCE price index; quarter-end rebalancing |
| Third Friday | Triple witching and index rebalances |
Jobs week
The sequence runs JOLTS, ADP, weekly claims and then the payrolls report on the first Friday of the full working week. Each measures something different and they are frequently read as a single build-up, which overstates their coherence.
JOLTS covers job openings, hires and quits with a lag, and the quits rate is the most useful line in it — workers voluntarily leaving is a direct measure of labour market confidence. ADP uses payroll processing data and has a mediocre record predicting the official figure. Weekly claims are the most timely genuine read on separations. The official report contains two surveys that regularly disagree, and the revisions to prior months frequently matter more than the headline.
Inflation week
CPI arrives at 8:30 a.m. Eastern, followed by PPI, with import prices completing the set. The core monthly change in CPI is the number the rates market trades; the annual headline is the number that leads the coverage.
PPI measures prices received by domestic producers and feeds forward into consumer prices with a lag. Its components also feed directly into the PCE price index — the Fed’s preferred gauge — which is why some analysts pay more attention to specific PPI lines than to the PPI headline itself. Import prices carry particular weight in the current tariff environment.
The timing matters this month: the CPI print lands days before the FOMC decision, inside the blackout period during which officials cannot comment. Markets therefore have to price the committee’s reaction without any guidance.
FOMC: decision day and projections
The September meeting concludes on the 16th with the statement and the Summary of Economic Projections at 2:00 p.m. Eastern, followed by the press conference at 2:30.
The projections are the substance. They contain the committee’s forecasts for growth, unemployment, inflation and the appropriate policy path — the dot plot. The dispersion of the dots matters as much as the median, particularly given the divided votes at recent meetings. The press conference frequently moves markets more than the statement, because it is where the reaction function gets described in words rather than in numbers.
Consumer and housing
Retail sales measure nominal spending and are not inflation-adjusted, so a rise can reflect higher prices rather than more purchasing. The control group — excluding autos, gasoline, building materials and food services — feeds into GDP and is the more useful figure.
Housing starts and existing home sales respond to mortgage rates with a lag of several months. With the long end elevated on term premium rather than on policy expectations, the mortgage channel has stayed tight independently of the Fed, which is the specific dynamic to watch in these releases.
Quarterly events
The third Friday of September brings triple witching — the simultaneous expiry of index futures, index options and single-stock options — which produces elevated volume concentrated in the closing auction. Index providers also conduct quarterly rebalances around the same date, forcing mechanical trading by passive funds.
Quarter-end brings its own flows: portfolio rebalancing between asset classes, and window dressing by funds adjusting holdings before reporting. These are calendar effects with mechanical causes, which distinguishes them from the statistical seasonality claims that attach to the month as a whole.
Treasury auction schedule
Treasury auctions run throughout the month on a published schedule, with the longer maturities carrying the most information. Results publish shortly after the 1:00 p.m. Eastern bidding deadline, and a weak long-dated auction can move the entire curve within seconds.
September also brings corporate bond issuance in volume as issuers return after the summer, which competes for the same buyers and adds hedging flow into rates markets.
How to use this calendar
The releases that reliably move markets are the jobs report, CPI and the FOMC decision. Everything else matters at the margin or matters only when it surprises substantially.
All dates and times are published in advance by the issuing agencies and are occasionally revised. Confirm against the BLS, BEA, Federal Reserve and Treasury calendars before relying on any specific date.