Every month, a few hundred phone calls to ordinary households move markets more than you’d think. The University of Michigan asks people how they feel about their finances, the economy, and where prices are headed — and traders, economists, and the Federal Reserve all lean in to listen. In mid-2026, with an energy-driven inflation shock still working through the system, that survey has become one of the more closely watched releases on the calendar.
This article is for informational and educational purposes only. It is not financial advice, investment advice, or a recommendation to buy, sell, or hold any security, cryptocurrency, or financial product. Always verify data with official sources before making financial decisions.
Short answer — what consumer sentiment measures
Consumer sentiment is a survey-based measure of how optimistic or pessimistic households feel about their personal finances and the broader economy. It’s not a hard data point like GDP or payrolls — it’s a mood reading, built by asking people questions and turning their answers into an index number. The best-known version comes from the University of Michigan, which has been running its Surveys of Consumers since the late 1940s.
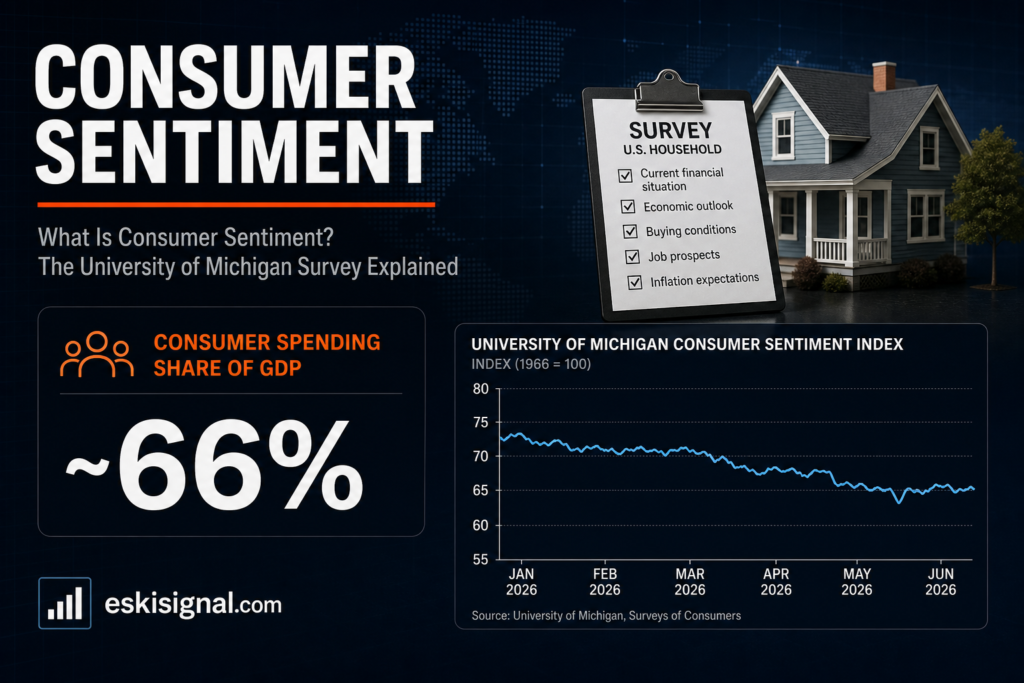
The idea behind it is simple: how people feel tends to shape what they do. If households feel squeezed by high prices or worried about their job security, they may pull back on spending. If they feel confident, they tend to keep spending, financing purchases, and taking on debt more freely. Since consumer spending makes up roughly two-thirds of US economic activity, a shift in mood can be an early signal of a shift in behavior — though, as we’ll get into later, the link between the two is looser than people often assume.
Michigan vs Conference Board — the two main surveys
There are two widely cited US sentiment gauges, and people mix them up constantly. The University of Michigan survey and the Conference Board’s Consumer Confidence Index both try to capture the same broad idea, but they ask different questions, sample differently, and sometimes move in different directions in the same month.
| Feature | University of Michigan | Conference Board |
|---|---|---|
| Publisher | University of Michigan (academic) | The Conference Board (private research group) |
| Sample size | ~500 households (preliminary), ~600+ (final) | ~3,000 households |
| Frequency | Preliminary and final reading each month | Monthly, single release |
| Emphasis | Heavier weight on inflation expectations and personal finances | Heavier weight on labor market perceptions (jobs “plentiful” vs “hard to get”) |
| Base year | Indexed to 1966 = 100 | Indexed to 1985 = 100 |
Neither survey is “more correct” than the other — they’re just tuned to slightly different things. Economists and Fed officials tend to watch Michigan more closely for inflation-expectations data specifically, while the Conference Board’s series is often treated as a cleaner read on how people view the job market.
What’s inside the survey
The Michigan survey isn’t a single question — it’s a bundle of them, rolled up into a few sub-indexes that each tell a slightly different story.
- Current conditions — how households view their present financial situation and whether now is a good time to make big purchases like a car or a home.
- Expectations — how people think their finances, and the broader economy, will look six to twelve months out. This tends to be the more forward-looking, and more volatile, half of the index.
- Inflation outlook — a separate set of questions asking what respondents expect prices to do over the next year and over the next five to ten years. This is the piece the Fed pays the closest attention to, because it hints at whether the public still trusts the central bank to keep inflation under control.
The headline number is a blend of current conditions and expectations. But it’s often the inflation-expectations component, released alongside it, that generates the most discussion among economists — especially when it starts drifting away from where actual inflation is running.
Why markets and the Fed watch it
Sentiment data gets outsized attention because it arrives faster than most “hard” economic data and offers a glimpse into what households expect before that expectation shows up in spending patterns. The Fed, in particular, cares about inflation expectations because they can become self-fulfilling — if people expect higher prices, they may push for higher wages or accept price increases more readily, which can help keep inflation elevated even after the initial shock fades.
That dynamic is front and center in mid-2026. At his first FOMC meeting as Fed chair on June 17, Kevin Warsh held the policy rate at 3.50%-3.75%, but the committee’s updated dot plot turned notably more hawkish. The catalyst was an energy-driven inflation shock tied to the Iran conflict and disruptions around the Strait of Hormuz, which pushed oil and, by extension, broader price pressures higher going into the summer. May 2026 CPI had already come in at 4.2% year-over-year, and May PPI — wholesale inflation — hit 6.5%, a three-year high. Against that backdrop, consumer inflation expectations become a key piece of evidence for whether the shock is staying “contained” to energy prices or bleeding into broader expectations. A later Iran deal eased oil prices in late June, but the FOMC’s more hawkish tilt reflected how seriously the committee was treating the risk that expectations could de-anchor.
When sentiment data shows inflation expectations climbing even as headline inflation is expected to cool, it gives policymakers a reason for caution — one more argument for holding rates higher for longer rather than easing quickly.
A real-world example (June 2026 reading)
Consider how a June 2026 University of Michigan reading might plausibly have looked, given everything happening that month. The headline index likely softened somewhat from earlier-year levels, with an illustrative reading somewhere in the mid-60s on the 1966-based scale, down from readings closer to the low-70s seen before the Iran-related energy shock took hold.
The current-conditions component probably held up better than the headline number suggests, supported by a still-solid labor market — May’s jobs report showed +172,000 payrolls added and unemployment at a moderate 4.3%. But the expectations component likely dropped more sharply, as households absorbed news of 4.2% CPI and a three-year-high PPI print, alongside media coverage of the Strait of Hormuz situation. Year-ahead inflation expectations in the survey plausibly ticked up toward the high-4% to 5% range, reflecting the same energy-driven price pressure showing up in the official data — even with the late-June Iran deal starting to bring oil prices back down. That kind of split — conditions holding, expectations wobbling — is a textbook example of why economists look at the sub-indexes and not just the headline.
Where this shows up on EskiSignal
We reference consumer sentiment data whenever it adds context to a bigger story — a CPI surprise, a Fed decision, or a shift in the market’s mood after an oil-price move. It’s rarely the headline of a piece on its own, but it’s often the supporting evidence that helps explain why a Fed statement leaned hawkish or dovish, or why a “soft” jobs number didn’t rattle markets as much as expected. If you’re tracking the broader inflation-versus-growth tug of war running through mid-2026, sentiment data is one of the threads worth following alongside CPI, PPI, and Fed commentary.
Mini glossary
| Term | Plain-English meaning |
|---|---|
| Consumer sentiment | A survey-based mood reading of how households feel about their finances and the economy. |
| Current conditions index | The part of the survey measuring how people view their situation right now. |
| Expectations index | The part of the survey measuring how people think things will look six to twelve months out. |
| Inflation expectations | What survey respondents think prices will do over the next year, and over the next five to ten years. |
| De-anchoring | When the public stops trusting that inflation will return to normal, making expectations harder to control. |
| Consumer confidence | The Conference Board’s competing sentiment measure, weighted more toward labor market views. |
Risks and limits — sentiment isn’t spending
It’s worth being careful about what sentiment data actually predicts. Studies going back decades have shown that changes in consumer sentiment correlate only loosely with changes in actual consumer spending. People routinely tell surveyors they’re worried about the economy while continuing to spend largely as before, because spending is driven by income, employment, and access to credit far more than by mood alone.
Sentiment surveys are also sensitive to what’s dominating the news cycle in a given week. A month with heavy coverage of an oil-price spike or a geopolitical flashpoint like the Strait of Hormuz situation can drag sentiment down even if household finances haven’t meaningfully changed yet. That’s part of why the preliminary and final Michigan readings can shift within the same month, and why economists generally treat sentiment as one data point among many rather than a standalone signal. It’s also worth remembering that small sample sizes, especially in the preliminary release, can make month-to-month swings noisier than they first appear.
What is consumer sentiment?
Consumer sentiment is a survey-based index measuring how optimistic or pessimistic households feel about their personal finances and the broader economy. It’s most commonly associated with the University of Michigan’s monthly survey, which has run since the late 1940s.
Who publishes it?
The University of Michigan publishes its Surveys of Consumers, while the Conference Board publishes a competing Consumer Confidence Index. Both are released monthly and are widely followed by economists and financial media.
Why does it matter?
It matters because household mood, particularly inflation expectations, can influence spending and wage-setting behavior in ways that feed back into actual inflation. The Fed watches it closely as one input among many when weighing policy decisions.
Sentiment vs confidence — what’s the difference?
They measure similar things but aren’t identical. “Sentiment” usually refers to the University of Michigan’s survey, with more emphasis on inflation expectations and personal finances, while “confidence” usually refers to the Conference Board’s index, which leans more heavily on perceptions of the labor market.
Sources
- University of Michigan — Surveys of Consumers methodology and monthly releases.
- The Conference Board — Consumer Confidence Index methodology and monthly releases.
- Federal Reserve — FOMC statements, minutes, and economic projections (Summary of Economic Projections).
- US Bureau of Labor Statistics — Consumer Price Index and Producer Price Index releases.