
EskiSignal
Market trend and regime explainers covering risk-on/risk-off behavior, trend changes, breadth shifts, and technical context for major assets.
Trends & Regimes
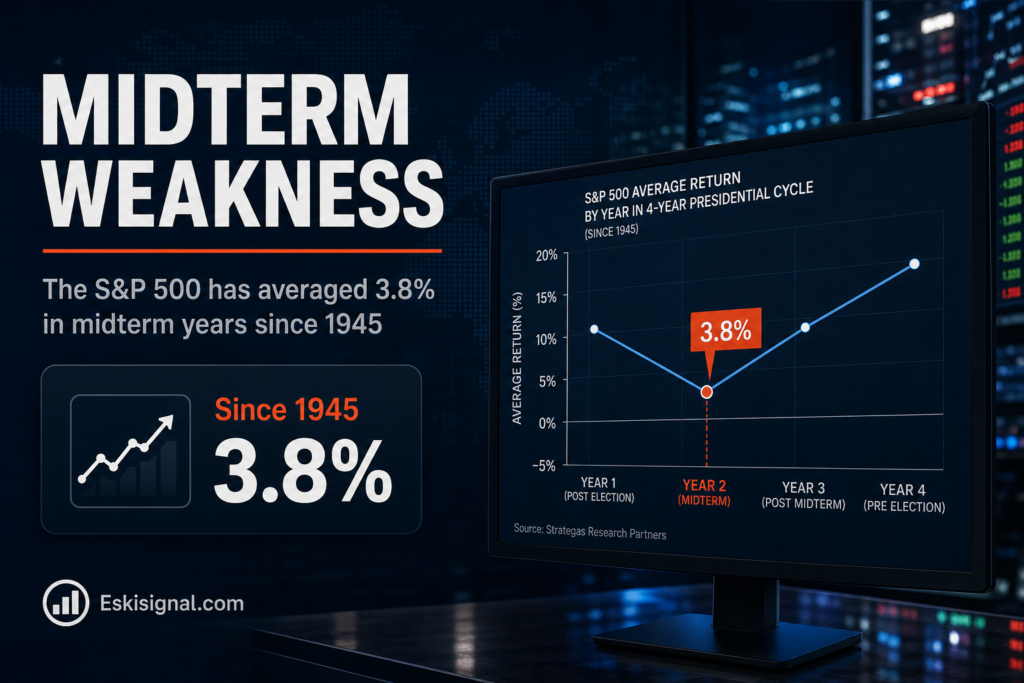
Midterm Years Are the Weakest Year of the Cycle: The Data Before November 3
Americans vote on 3 November. The statistic that will be quoted at every point between now and then is that...

Trends & Regimes
Equal Weight vs Cap Weight: What RSP Tells You That SPY Does Not
RSP and SPY hold the same 500 companies. Over the past decade they have delivered materially different returns, taken different...

Trends & Regimes
Market Breadth Is Narrowing While Indexes Sit Near Records
An index can rise while most of its members fall. When that happens for long enough, analysts start using the...
Trends & Regimes
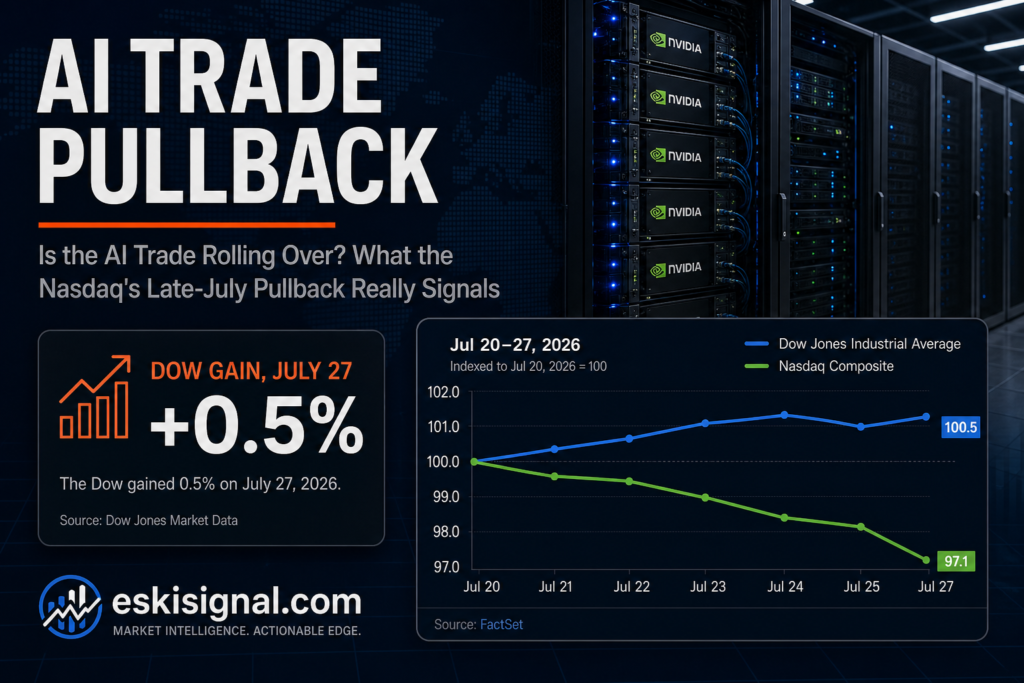
Is the AI Trade Rolling Over? What the Nasdaq’s Late-July Pullback Really Signals
Nvidia and other AI leaders wobbled as investors questioned the return on massive capex — how to tell a healthy rotation from the start of a bigger regime change.
MarketsTrends & Regimes
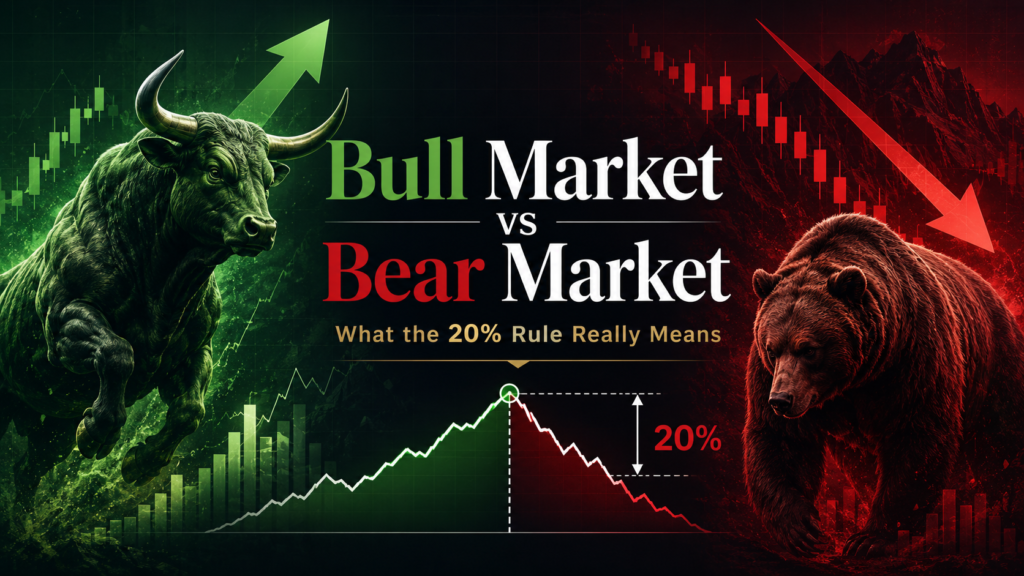
Bull Market vs Bear Market: What the 20% Rule Really Means
A bull market is a sustained rise; a bear market is a 20%+ drop from a peak. Here is what the thresholds mean, plus corrections and pullbacks, explained.




