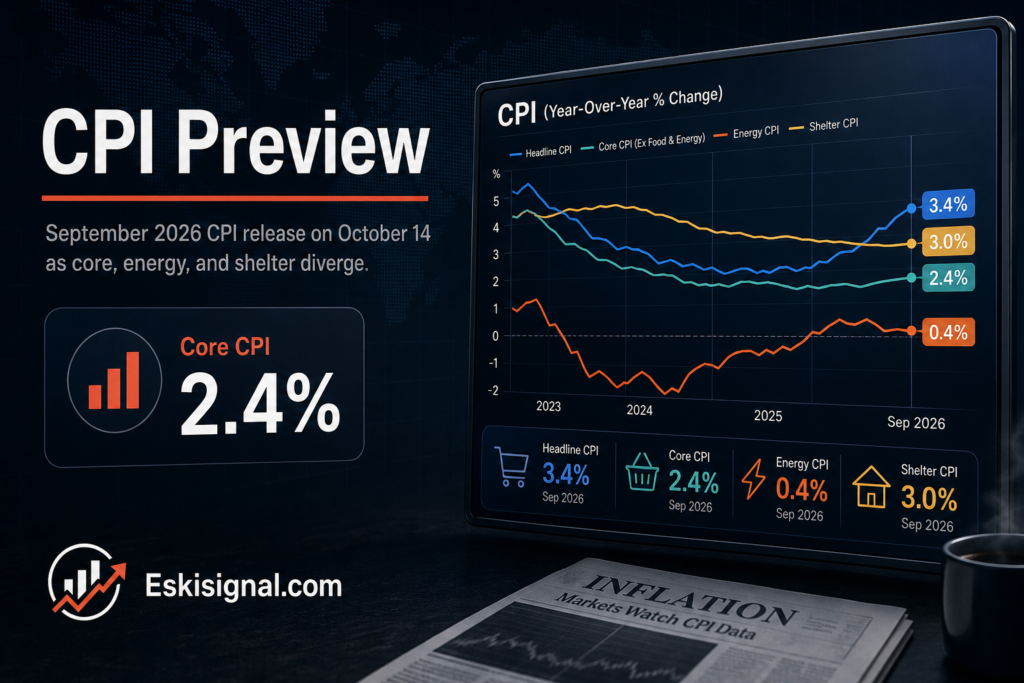
The September Consumer Price Index arrives on October 14, two weeks before a Federal Reserve meeting with no updated projections attached. It is the last major inflation reading the committee gets, and it lands in a month where headline and core inflation have been pointing in opposite directions.
This article is for informational and educational purposes only. It is not financial advice, investment advice, or a recommendation to buy, sell, or hold any security, cryptocurrency, or financial product. Always verify data with official sources before making financial decisions.
Release time and what the report decides
Short answer: The Bureau of Labor Statistics publishes September CPI at 8:30 a.m. Eastern on Wednesday, October 14, 2026. The figures that matter are core CPI on a monthly basis, the energy components, and core services excluding housing. With the October FOMC meeting on the 27th and 28th and no Summary of Economic Projections attached to it, this print carries more weight than a single monthly reading usually would.
Where August left the series
| Measure | August 2026 | Detail |
|---|---|---|
| Headline CPI, y/y | 3.4% | Unchanged from July |
| Headline CPI, m/m | +0.4% | Up sharply from +0.1% in July |
| Core CPI, y/y | 2.4% | Lowest in several years |
| Core CPI, m/m | +0.3% | Above the +0.2% consensus |
| Gasoline, m/m | +3.9% | Main driver of the headline acceleration |
That table contains the whole argument. Annual core inflation at 2.4% is close to target and falling. Monthly headline inflation at 0.4% is running at an annualised pace near 5%. Both are accurate descriptions of the same month, and which one you lead with determines whether you think policy is too tight or not tight enough.
The energy problem is in refining, not crude
The distinction matters for forecasting this print. Crude prices have been elevated — Brent approached $99 in early October after attacks on Saudi energy facilities — but the sharper move has been in refined products. US diesel reached a record, and middle distillate crack spreads moved above outright crude prices.
A refining bottleneck transmits to consumer prices differently from a crude shock. Gasoline responds directly and quickly, which is what showed up in the August report. Diesel reaches consumers indirectly, through the cost of moving every physical good, and arrives with a lag of months spread across the goods basket rather than concentrated in one line.
That second channel is the one to watch in core goods. If September core goods prices firm, the freight pass-through has begun, and that is a harder problem than gasoline because it does not reverse when a crude price does.
Core services excluding housing
This component is not published as a headline figure and has to be built from the detail tables, which is why it appears in commentary a few hours after the release rather than immediately.
It matters because it is the part of inflation closest to wages and furthest from commodities. With average hourly earnings growing 3.0% annually as of September, the wage-driven inflation case is weak. A soft reading here would support the argument that the inflation problem is entirely a supply shock, and that monetary policy is the wrong instrument for it.
Shelter still carries the most weight
Shelter is roughly a third of the basket and the largest single component, which means it can offset a great deal of movement elsewhere. A soft shelter print can hold core down even while goods and energy firm.
It is also the slowest-moving component, because the index measures rents across the full stock of leases rather than only new ones. That produces a long lag behind market rents and makes shelter the most predictable line in the report — and the one least likely to surprise.
How to read the release in the first minute
Core month over month against consensus, first. Then shelter, to see whether a soft core reading is broad or concentrated in one component. Then core goods, for the freight pass-through. Then check whether August was revised.
A ten-second check that prevents most misreadings: compare headline and core monthly figures. A large gap means the move is energy and food, which the Fed will discount. A small gap means the pressure has spread, which it will not.
What the market has already priced
Rate expectations moved sharply in the first week of October. After the September jobs report showed 29,000 payrolls and 60,000 of downward revisions, futures implied roughly 77% odds the Fed holds in October, reversing a late-September position in which a hike had been more likely than not.
That leaves this print with unusual leverage. A soft core number consolidates the hold case. A firm one reopens a question markets had largely closed, with no projections at the October meeting to clarify where the committee stands.
Risks, uncertainty, and limits
Consensus forecasts move in the days before release, and CPI seasonal adjustment factors are revised annually in a way that can change recent monthly figures without new underlying data.
This is a guide to reading the release, not a forecast of it. Single monthly inflation readings have a poor record as standalone signals, and the BLS publishes the full component detail and methodology alongside each report.