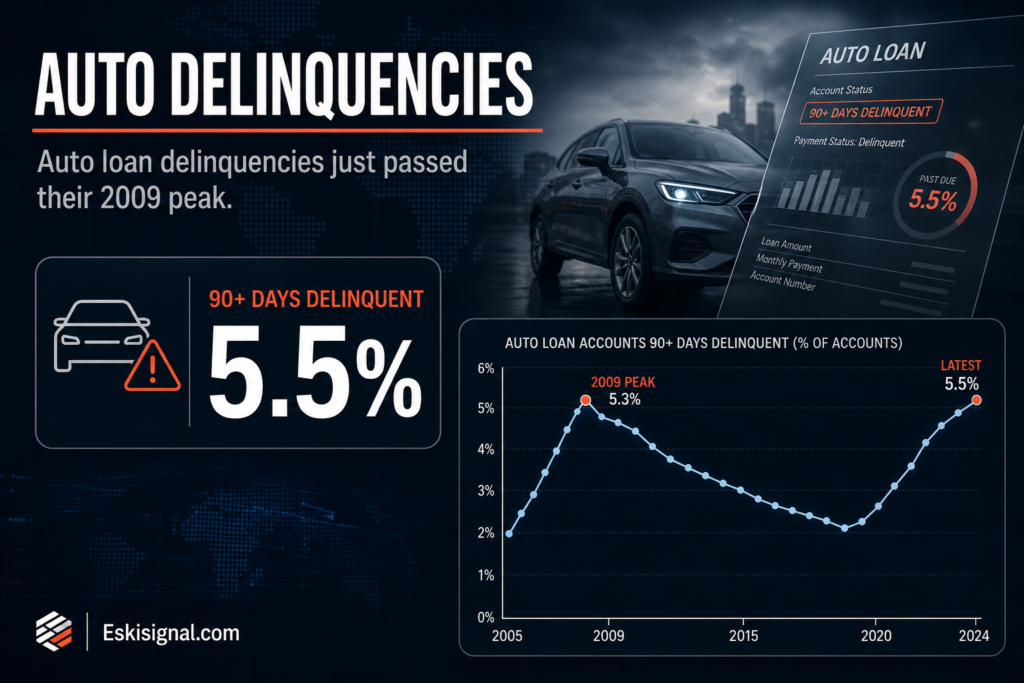
The share of US auto loan balances ninety or more days delinquent reached 5.5% in the second quarter of 2026. The peak reached during the global financial crisis was 5.3%. That comparison is doing a lot of work in commentary at the moment, and it deserves to be handled carefully, because the headline is accurate and the obvious inference from it is not.
This article is for informational and educational purposes only. It is not financial advice, investment advice, or a recommendation to buy, sell, or hold any security, cryptocurrency, or financial product. Always verify data with official sources before making financial decisions.
Short answer: a distribution problem wearing an aggregate’s clothes
Short answer: Serious auto delinquencies are above their 2009 peak, and student loan delinquencies are worse still at 10.6% of balances. But aggregate household balance sheets are not in crisis, and prime borrowers are performing normally. What the data describes is a bifurcation — the K-shaped credit market that TransUnion and others have been documenting — where stress is concentrated in subprime and near-prime cohorts while the top of the distribution keeps the averages respectable. The 2009 comparison is misleading because in 2009 the stress was general.
Why auto loans are the informative series
Household payment hierarchy is one of the more durable findings in consumer credit research, and it has inverted over the past two decades. Before 2008 the mortgage was paid first. After the foreclosure crisis, borrowers under strain began prioritising the car — because in most of the United States a car is how you reach the job that produces the income that pays everything else.
That is why an auto delinquency reading carries more diagnostic weight than its share of household debt suggests. When borrowers stop paying the obligation they normally protect first, they have generally run out of other options. It is a late-stage indicator, not an early one.
The mechanics of the loan itself amplify the signal. Vehicle prices rose sharply, loan terms extended to seventy-two and eighty-four months to keep monthly payments manageable, and the combination leaves a large population owing more than the vehicle is worth for most of the loan’s life. Negative equity removes the escape route: a borrower who cannot sell the car for enough to clear the loan cannot solve the problem by selling the car.
| Series | Latest | Reference point |
|---|---|---|
| Auto loans 90+ days delinquent | 5.5% (Q2 2026) | GFC peak 5.3% |
| Student loans 90+ days delinquent | 10.6% (Q2 2026) | Elevated post-repayment restart |
| Subprime auto ABS 60+ days | Above 6% through late 2025 | Historically 3-4% |
| Total household debt | $18.19 trillion (Q1 2026) | Record nominal level |
The student loan number needs a caveat attached to it
A 10.6% serious delinquency rate on student debt looks alarming next to any other consumer category, and it is partly an artefact of how the series was suppressed and then released.
During the payment pause, delinquencies were not merely low; they were largely not reported. When reporting resumed, a backlog of borrowers who had not been paying appeared in the data over a small number of quarters rather than accumulating gradually. Some of that jump is the recognition of pre-existing non-payment rather than new deterioration, which means the level overstates the change even though the level itself is real. The rate of change from here is the more informative statistic, and it is a shorter series than anyone would like.
The lending data complicates the story further
If lenders believed a broad consumer credit deterioration were underway, they would be tightening at the bottom of the distribution. Some of the data points the other way. Subprime bankcard originations rose 18.6% over a recent twelve-month period, and credit limits extended to that group rose 37.6%.
Two readings compete. The benign one is that lenders have improved underwriting to the point where they can price this cohort profitably, and expanding into it is a considered commercial decision rather than a lapse in standards. The less benign one is that credit is being extended to borrowers whose existing obligations are already deteriorating, which supports consumption now and worsens the delinquency series later.
Distinguishing them requires vintage analysis — tracking how loans originated in a given quarter perform over subsequent quarters — rather than looking at aggregate delinquency, which mixes vintages with very different characteristics. Vintage curves are published by the major bureaus and by ABS trustees, and they are where this argument will actually be settled.
Why this matters beyond the borrowers involved
Consumption is concentrated at the top of the income distribution, and that concentration is why aggregate spending has held up while the bottom cohort has struggled. It also caps the macroeconomic significance of this stress: a deterioration among borrowers who account for a modest share of total spending does not, by itself, produce a recession.
Where it does matter is in the securitisation market, in the earnings of lenders exposed to those cohorts, and as a leading indicator of labour market weakness that has not yet appeared in payrolls. Serious delinquency is usually a lagging consequence of job loss. When it rises while the unemployment rate is stable, one of the two series is telling the wrong story, and that tension is worth watching rather than resolving prematurely.
The honest counterargument
The strongest case against reading any of this as a warning is compositional, and it is a good argument.
The subprime share of auto originations is larger than it was in 2007, so a higher delinquency rate is partly arithmetic: a pool containing more risky loans produces more delinquencies without any individual borrower being worse off than their predecessor. Loan terms are longer, which mechanically raises the number of loans in their higher-risk middle years at any moment. And the 2009 comparison is unbalanced in the other direction too, since in 2009 auto delinquency was rising alongside 10% unemployment. Matching that number with unemployment near 4% describes a fundamentally different economy.
What this article does not conclude
Nothing here forecasts a recession, consumer defaults, or the performance of any lender or securitisation. Delinquency series are not directly comparable across sources: the New York Fed’s household debt data, the credit bureaus and ABS trustee reports use different populations, definitions and delinquency buckets, and figures cited from one should not be mixed with another.
The New York Fed’s quarterly Household Debt and Credit Report is the standard public reference and is released free with full underlying tables. Where this article cites bureau data, that data is proprietary and the summary published by the bureau is what is publicly checkable.