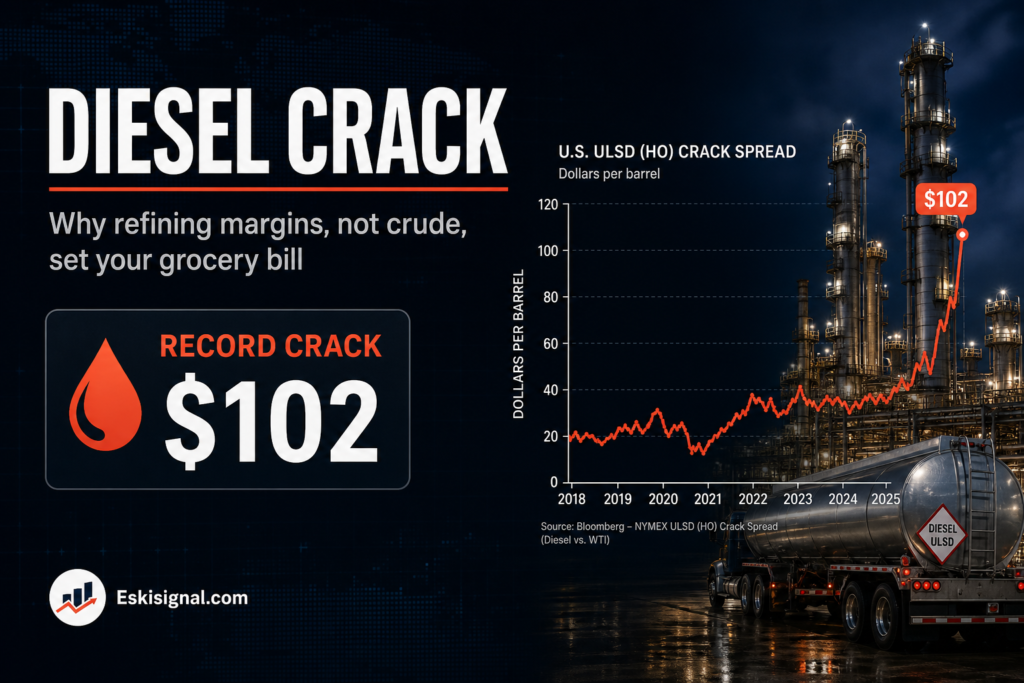
Crude oil gets the headlines. The number that has actually broken records this year sits one step downstream: the US diesel crack spread reached roughly $102 a barrel on 17 August, an all-time high, against a pre-crisis normal range of $15 to $25. Crude at $96 is expensive. A $102 crack is a different kind of problem, and it reaches the economy through freight rather than through the petrol pump.
This article is for informational and educational purposes only. It is not financial advice, investment advice, or a recommendation to buy, sell, or hold any security, cryptocurrency, or financial product. Always verify data with official sources before making financial decisions.
Short answer: the margin between crude and the fuel made from it
Short answer: A crack spread is the difference between the price of a refined product and the price of the crude oil used to make it. It is the refiner’s gross margin, and it is quoted in dollars per barrel. When the diesel crack is $102, it means diesel is selling for $102 per barrel more than the crude feedstock costs — the refining step, not the oil in the ground, accounts for most of the price. A record crack signals a shortage of refining capacity or of a specific product, not a shortage of crude.
Why the distinction between crude and product matters
A crude shortage and a product shortage call for different responses and have different durations. If crude is scarce, producers can lift output, strategic reserves can be released, and the constraint eases within months. If the constraint is refining capacity, none of those helps, because the bottleneck is a physical plant that takes years and a great deal of capital to build and that nobody has been eager to finance in a decade of energy-transition policy.
The current episode has both, which is why it has been persistent. Attacks on Middle East energy infrastructure and shipping have disrupted crude flows and pushed Brent above $100. Underneath that, the distillate pool — diesel, heating oil and the feedstocks behind jet fuel — was already tight before this year’s escalation.
| US diesel crack spread | Level | Context |
|---|---|---|
| Typical pre-crisis range | $15-25 | Normal refining margin |
| Russia-Ukraine peak (2022) | High $80s to low $90s | Previous record |
| March 2026 | $97-98 | First approach to the record |
| 17 August 2026 | $102.20 intraday | All-time high |
The inventory picture behind the number
US distillate stocks stood at approximately 105.6 million barrels for the week ending 14 August — the lowest level for that point in the calendar since the mid-1990s, and roughly 12% to 13% below the five-year average. Inventory that thin removes the buffer that normally absorbs a supply disruption, which is why the crack has responded so violently to news rather than trading in a range.
The obvious question is why refiners have not simply produced more, given margins this extraordinary. They have. Utilisation has been high and export volumes have been at records. The constraint is that a refinery is not a switch. Each facility has a configuration that determines how much of a barrel becomes distillate versus gasoline, and shifting that mix meaningfully requires hydrocracking capacity that either exists or does not. Above a certain point, additional diesel can only come from running more crude in total, which produces more gasoline as a by-product whether or not the market wants it.
Why diesel reaches consumer prices differently from petrol
Petrol is a consumer good. When it rises, households feel it immediately and directly, and it shows up in the energy component of the inflation basket where economists routinely strip it out as volatile.
Diesel is an input. It moves lorries, freight trains, ships, tractors, excavators and standby generators. Its price enters the cost base of nearly every physical good before that good reaches a shelf, and it does so with a lag measured in weeks to months as contracts reprice and fuel surcharges reset. That is why a diesel shock tends to appear in core goods inflation and in food prices rather than only in the headline energy line, and why it is harder for a central bank to dismiss as transitory noise.
The seasonal timing is unhelpful. Distillate demand in the northern hemisphere rises into the fourth quarter as heating oil draws from the same pool, arriving on inventories that are already at multi-decade seasonal lows.
| Where to watch it | Release | What it tells you |
|---|---|---|
| Distillate stocks | EIA Weekly Petroleum Status Report, Wednesdays | Whether the buffer is rebuilding or draining further |
| Refinery utilisation | Same report | Whether capacity is the binding constraint |
| Diesel crack | ULSD futures minus crude, CME | The margin itself, in real time |
| Retail diesel | EIA weekly retail prices, Mondays | How much has reached the freight sector |
The honest counterargument
Extreme crack spreads are self-correcting, and the correction can be fast enough to make any analysis built on them look foolish within a quarter.
Margins of this size draw every available barrel of distillate toward the highest-paying market, pull forward maintenance deferrals, and incentivise refiners globally to maximise distillate yield at the expense of everything else. Demand also responds: high diesel prices slow freight volumes, and slowing freight reduces diesel demand. The 2022 episode peaked and then unwound substantially inside a year without any new refinery being built. Anyone treating $102 as a durable new normal is extrapolating from the least stable series in energy markets.
The case that this time is more persistent rests on the inventory position rather than on the price — a buffer at mid-1990s seasonal lows going into heating season leaves less room for the usual self-correction to work quietly.
What this article does not conclude
Nothing here forecasts diesel prices, crack spreads, refining margins or the profitability of any refiner. Crack spread conventions vary — the figures cited are for US ultra-low-sulphur diesel against a crude benchmark, and quotes constructed against different crudes or in different regions will not match.
Inventory and utilisation data come from the EIA’s weekly report and are revised. Price levels cited are as of mid-August and early September 2026 and have moved since. The relationship between diesel costs and consumer prices is real but the size and speed of the passthrough is contested in the research literature, and no single elasticity should be treated as settled.