
Last updated: June 17, 2026, 10:30 AM ET
Topic: market cycles (educational explainer).
This article is for informational and educational purposes only. It is not financial advice, investment advice, or a recommendation to buy, sell, or hold any security, cryptocurrency, or financial product. Always verify data with official sources before making financial decisions.
Short answer: what is a bull market vs a bear market?
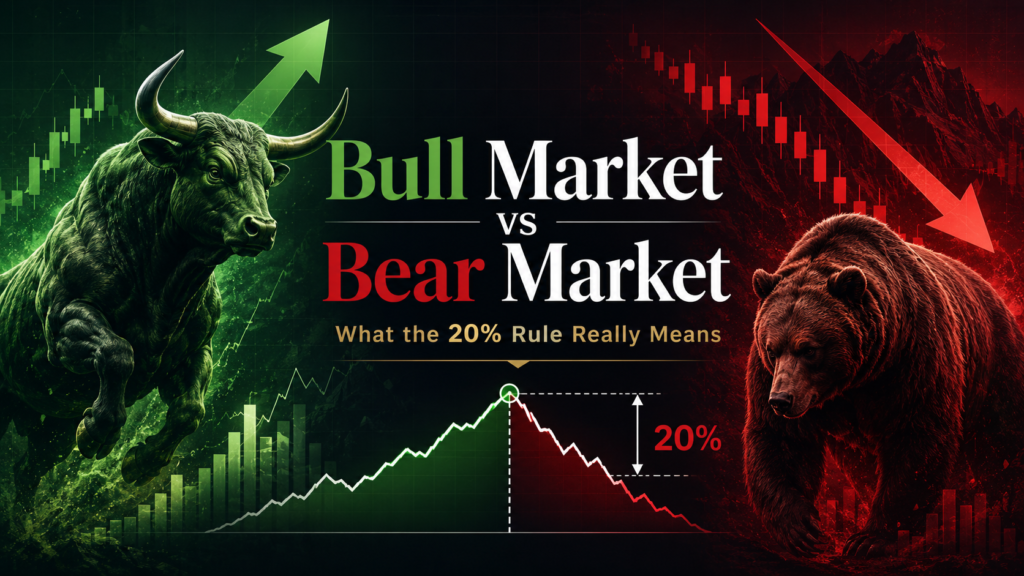
A bull market is a sustained period of rising prices; a bear market is a sustained period of falling prices. The most common convention defines a bear market as a decline of 20% or more from a recent peak in a major index like the S&P 500, and a bull market as a recovery and rise from a low. Smaller pullbacks have their own labels: a drop of 10% or more (but less than 20%) is usually called a correction. These thresholds are widely used conventions, not official rules, and they describe direction and magnitude — not what happens next.
The thresholds, side by side
| Term | Common definition | Typical framing |
|---|---|---|
| Bull market | Sustained rise from a low | Optimism, rising prices |
| Bear market | Decline of 20%+ from a peak | Pessimism, falling prices |
| Correction | Decline of 10–20% from a peak | A pullback within a trend |
| Pullback | A smaller dip (often <10%) | Routine fluctuation |
Why the terms matter
The labels shape how news and commentary describe the market mood, and they can affect sentiment. But they are backward-looking: a market is only confirmed to be in a bear market after it has already fallen 20%. The terms tell you what has happened, not what will happen. A bear market does not guarantee further declines, and a bull market does not guarantee continued gains.
How bulls and bears unfold
- Bull markets often feature improving sentiment, rising breadth, and new highs.
- Bear markets often feature heightened volatility, defensive rotation, and lower lows.
- Transitions are usually clear only in hindsight; turning points are hard to call in real time.
- Cycles vary: length and depth differ widely from one cycle to the next.
A real-world framing
In 2026, major indexes have swung with the news — from energy-shock selloffs to rallies on the U.S.–Iran framework deal. Whether a given move is a routine pullback, a correction, or the start of a bear market is only confirmed by how far prices ultimately travel from their peak. That is why disciplined commentary describes moves by their measured size rather than predicting the next leg.
Where this shows up on EskiSignal
- Crash vs Correction — how to size a drawdown.
- What Is the VIX? — gauging market stress.
- Crude Oil Futures: WTI vs Brent — how oil benchmarks work.
Mini glossary
| Term | Plain-English meaning |
|---|---|
| Drawdown | The decline from a peak to a trough |
| Breadth | How many stocks participate in a move |
| Defensive rotation | Shift toward steadier sectors in stress |
| All-time high | A new record price level |
Risks, uncertainty, and limits
- Thresholds (20%, 10%) are conventions, not laws.
- The labels are backward-looking and do not predict direction.
- This is educational content, not advice or a market call.
What this article does not conclude
This explainer defines bull and bear markets. It does not predict the market’s direction or recommend any action.
What is the difference between a bull and bear market?
A bull market is a sustained rise in prices; a bear market is a sustained decline, commonly defined as a drop of 20% or more from a recent peak in a major index.
What counts as a correction?
A correction is usually a decline of 10% or more, but less than 20%, from a recent peak — a pullback within a broader trend.
Is a bear market the same as a crash?
Not exactly. A crash is a sudden, sharp drop over a short period, while a bear market is a sustained 20%+ decline that can unfold over weeks or months.
Does a bear market predict more losses?
No. The term is backward-looking and describes a decline that has already happened. It does not forecast the next move. This article does not give market predictions.
Sources
- General market references on bull/bear definitions and thresholds.
- Historical index data on past market cycles.





