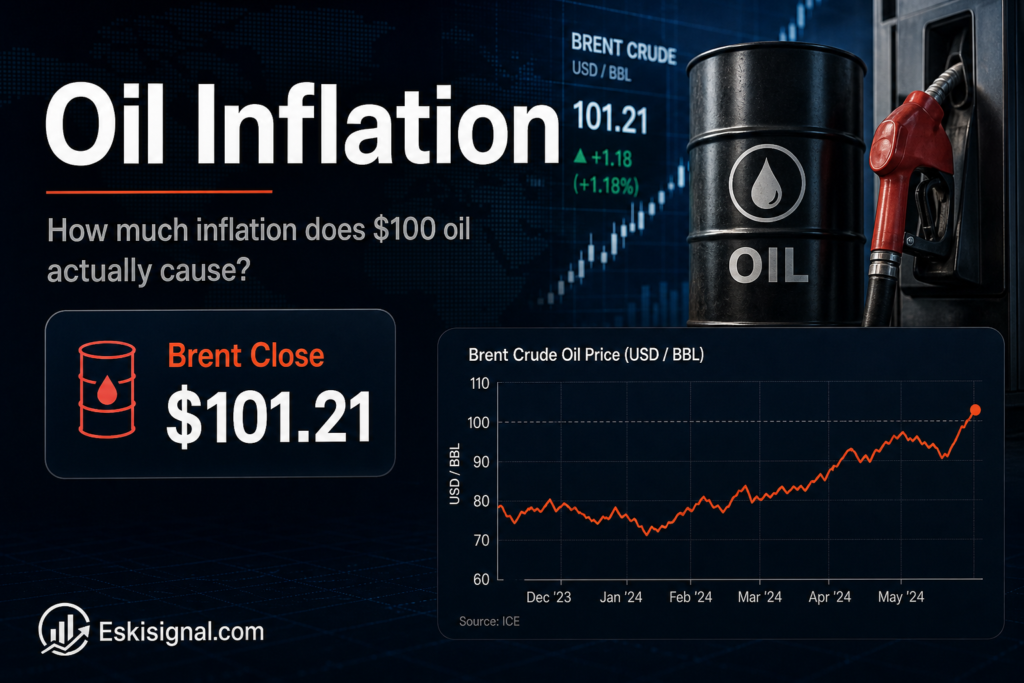
Brent settled at $101.21 this week, its first close above $100 since July. The immediate question for anyone watching the Fed is arithmetic rather than geopolitical: how much inflation does that actually produce, and when? The Federal Reserve Bank of Dallas has published research attempting to answer precisely this for the current conflict, and the number is smaller than the headlines imply — and slower to arrive.
This article is for informational and educational purposes only. It is not financial advice, investment advice, or a recommendation to buy, sell, or hold any security, cryptocurrency, or financial product. Always verify data with official sources before making financial decisions.
Short answer: less than intuition suggests, over longer than a quarter
Short answer: Energy is a modest direct weight in the consumer price basket, so even a large percentage move in crude translates into a much smaller move in headline CPI. The mechanical direct effect arrives within weeks, largely through petrol. The indirect effect — energy as an input into transport, plastics, fertiliser, packaging and everything they touch — is larger in aggregate but spreads over several quarters and is much harder to isolate. The reason central bankers watch oil so closely is not the arithmetic. It is that a sustained energy shock can move inflation expectations, and expectations are not mechanical at all.
The direct channel is smaller than most people assume
Energy commodities are a single-digit percentage weight in the US consumer price index. Motor fuel is the dominant component of that. A doubling of crude does not double petrol, because crude is only part of the pump price — refining margin, distribution, marketing and taxes make up the rest, and taxes in particular are fixed in cents rather than percentages, which damps the passthrough.
Work at central banks converging on this question generally finds that a 10% sustained rise in crude adds a few tenths of a percentage point to headline CPI over the following year through the direct channel, with the effect on core measures substantially smaller. That is the arithmetic reason the standard advice is to look through energy shocks, and it is sound advice most of the time.
| Channel | Speed | Size | Shows up in |
|---|---|---|---|
| Direct: petrol and household energy | Days to weeks | Modest, mechanical | Headline CPI energy line |
| Indirect: freight, plastics, fertiliser, packaging | One to four quarters | Larger in aggregate, diffuse | Core goods, food at home |
| Expectations | Unpredictable | Potentially the largest | Surveys, breakevens, wage demands |
Why 2026 is a harder case than the model implies
Standard passthrough estimates are built on crude oil shocks. This year’s shock is not confined to crude. The distillate market — diesel, heating oil, jet fuel feedstock — is tighter than the crude market, with the US diesel crack spread hitting an all-time record above $100 a barrel in August against a normal range of $15 to $25.
That distinction matters for the passthrough estimate, because diesel loads onto the indirect channel far more heavily than petrol does. Petrol is mostly a household expense. Diesel is a business input in the cost base of nearly every physical good. A shock concentrated in distillate should therefore be expected to produce a smaller immediate headline effect and a larger, slower core goods effect than the crude-based models predict.
There is a second complication specific to this year. Tariff passthrough is still working through goods prices, and both shocks land on the same categories. Disentangling how much of a rise in a core goods component is tariff and how much is freight cost is genuinely difficult, and any confident attribution should be treated with suspicion.
The expectations channel, which is where the risk actually lives
Central banks tolerate energy shocks because they are supply events that reverse. Raising rates does not produce more diesel; it only suppresses demand for everything else while the physical shortage resolves itself. The textbook response is to look through it.
The condition attached to that advice is that inflation expectations stay anchored. If households and firms begin to assume higher inflation persists — building it into wage negotiations, contract pricing and lease escalators — then a temporary supply shock becomes an embedded one, and unwinding it requires exactly the demand suppression that looking through was meant to avoid. This is why the Fed’s public language has focused on expectations rather than on oil, and why petrol prices carry disproportionate weight in consumer surveys: they are the most visible price in the economy and they update daily on large illuminated signs.
The relevant complication is duration. The current conflict began in late February. A shock entering its seventh month is harder to describe as transitory than one entering its second, regardless of what the passthrough coefficient says.
| What to watch | Source | Why |
|---|---|---|
| CPI energy and core goods lines | BLS monthly CPI release | Separates direct from indirect passthrough |
| 5y5y forward breakeven | FRED, TIPS-derived | Whether long-run expectations are drifting |
| University of Michigan expectations | Monthly survey | Household expectations, petrol-sensitive |
| PPI transport and warehousing | BLS monthly PPI release | Freight costs before they reach consumer prices |
The honest counterargument
The case for dismissing the whole passthrough framework in current conditions is stronger than usual.
Elasticities estimated on historical data assume the structure of the economy that generated that data. The US is now a net exporter of crude rather than a large net importer, which changes the aggregate income effect of a price rise substantially — higher oil transfers income between American regions and sectors rather than out of the country. The energy intensity of GDP has also fallen for four decades. Both arguments imply the historical coefficients overstate the damage, and both are correct as far as they go.
What they do not address is that the inflation measure is not GDP. A household spending a larger share of income on fuel does not benefit from a Texas producer’s improved margin, and the CPI does not net the two against each other.
What this article does not conclude
Nothing here forecasts CPI, PCE, oil prices or the Fed’s response to any of them. Passthrough estimates vary widely across studies depending on sample period, model specification and whether the shock is identified as supply-driven or demand-driven, and the ranges in the literature overlap enough that citing a single coefficient as the answer would misrepresent the state of the research.
Readers wanting the underlying work rather than a summary of it should go to the source: the Dallas Fed publishes its working papers openly, as do the other reserve banks and the CEPR’s policy portal. Price levels cited are as of 9 September 2026.