
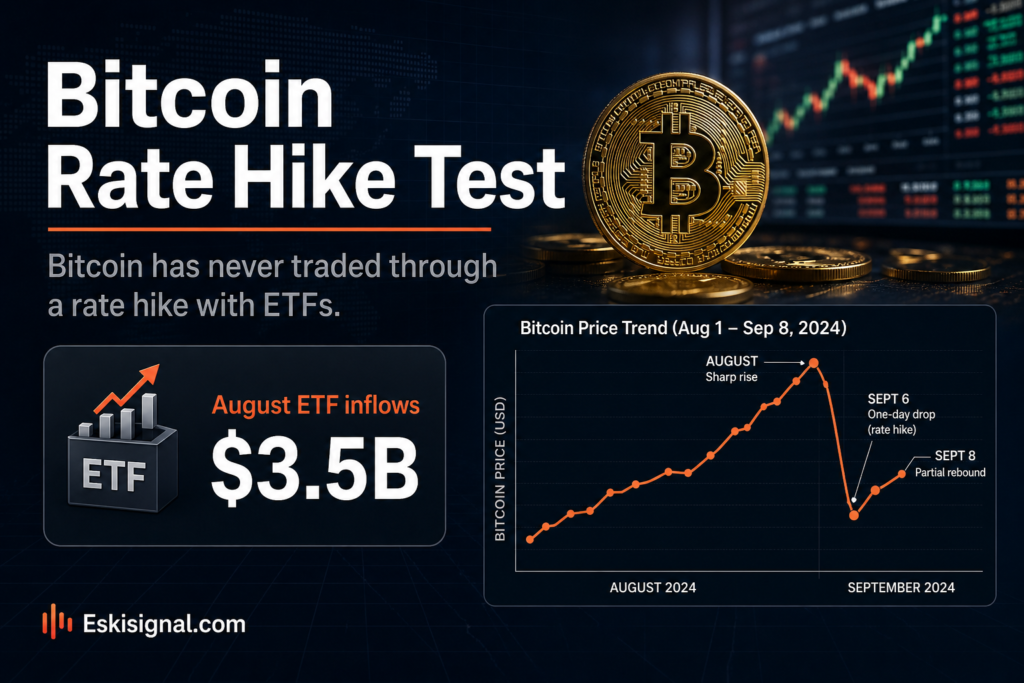
Bitcoin rose almost 25% in August on record spot ETF inflows of roughly $3.5 billion, then opened September with a single day of $236 million in net redemptions, more than $200 million of which came from one fund. It trades near $78,000, still down about 10% for the year. Underneath the price action is a question with no historical answer: bitcoin has been through a Federal Reserve tightening cycle before, but never with a spot ETF sitting between the asset and its largest holders.
This article is for informational and educational purposes only. It is not financial advice, investment advice, or a recommendation to buy, sell, or hold any security, cryptocurrency, or financial product. Always verify data with official sources before making financial decisions.
Short answer: the holder base changed, so the reaction function might too
Short answer: In the 2022-23 tightening cycle, the marginal buyer and seller of bitcoin was a crypto-native participant, often leveraged, transacting on exchanges. Today a large and growing share sits in spot ETFs held through brokerage and advisory channels, where the decision to buy or sell is frequently made by an allocation policy rather than by conviction about bitcoin. That is a structural change in who sets the price at the margin, and there is no prior tightening cycle to observe how that holder behaves when rates rise.
Why the 2022 comparison is weaker than it looks
The obvious objection is that the experiment has already been run. The Fed raised rates aggressively in 2022, bitcoin fell roughly two-thirds, and the conclusion writes itself.
The problem with that reading is contamination. The same period contained the collapse of a major algorithmic stablecoin, the failure of several large centralised lenders, and the bankruptcy of one of the largest exchanges in the industry. Those were endogenous credit events, and they would have produced a severe drawdown at any policy rate. Attributing the decline to monetary tightening requires separating it from a sequence of failures that were destroying leverage inside the asset class simultaneously, and the data does not permit that separation cleanly.
What can be said is narrower and more useful: in that episode bitcoin behaved like a high-beta risk asset rather than like a hedge, and nothing since has established that the behaviour has changed.
The flow data is the genuinely new instrument
The most underrated consequence of the ETF structure is not who holds the asset. It is that their behaviour is now published daily.
Before 2024, estimating whether institutional money was entering or leaving required inference from on-chain heuristics, exchange balances and custodian rumour. Now a specific dollar figure appears each afternoon, fund by fund. That changes the analytical problem in both directions: it removes a great deal of guesswork, and it creates a widely watched number that can itself drive sentiment, since a run of outflow headlines is a story that circulates whether or not the amounts are material relative to market capitalisation.
| US spot bitcoin ETF flows | Net |
|---|---|
| July 2026 | ~$172 million in |
| August 2026 | ~$3.52 billion in — strongest month of the year |
| 1 September | ~$236 million out |
| 2-3 September | ~$832 million in |
The sequence above is worth reading carefully, because it is a good example of how misleading a single session can be. A $236 million outflow generated considerable commentary. Two sessions later the three-day total was a net inflow of roughly $595 million. Daily flow data is high-frequency and noisy, and treating one print as a signal is the most common error made with it.
Concentration is the part that deserves more attention
The September redemption is instructive less for its size than its distribution: roughly $201 million of a $236 million net outflow came from a single fund, with another $44 million from the second largest and a small inflow into a third.
That concentration is a standing feature rather than a one-day quirk. When one vehicle holds a dominant share of ETF assets, its flows are effectively the asset class’s flows, and its holder base — heavily intermediated through advisory platforms and model portfolios — becomes the marginal price-setter. Model portfolio rebalancing is periodic, mechanical and executed in size, which is a different flow pattern from either retail sentiment or crypto-native leverage. It has not yet been observed through a rate-rise episode.
The competing store-of-value problem
There is an awkward fact for the digital gold framing this year: actual gold is near $4,395 and has been making records, while bitcoin is down for the year. If both assets were being bought primarily as hedges against monetary debasement and geopolitical risk, they should not be diverging this sharply during a period featuring an oil shock, a war and public political pressure on the central bank.
The most parsimonious explanation is that they are being bought for different reasons by different buyers — gold by central banks and reserve managers acting on policy mandates, bitcoin by return-seeking investors whose appetite falls as risk-free yields rise. That reading is unflattering to the hedge thesis and fits the price action better than the alternatives.
The honest counterargument
The bull case does not depend on bitcoin being a hedge, and the strongest version is structural.
ETF access has only recently reached the wirehouse and advisory platforms where the majority of American investable assets are allocated, and platform approval is a slow, one-directional process. On this view the relevant flow is a multi-year adoption curve that is barely started, and the macro environment determines its slope rather than its direction. August’s $3.5 billion is offered as evidence: it arrived in a month when yields were rising and hike expectations were increasing, which is precisely when the macro thesis says flows should have been negative.
What this article does not conclude
Nothing here forecasts the bitcoin price, ETF flows, or the Federal Reserve’s September decision. The central claim is that a structural feature of this market is new and therefore untested, which is an argument for wider uncertainty rather than for a direction.
Flow figures are compiled by third-party trackers from fund disclosures and are frequently revised; different trackers publish different daily totals for the same session. Prices cited are from early September 2026. Anyone relying on flow data should take it from the issuers’ own published holdings rather than from aggregated headlines, and should be aware that a creation or redemption reflects a market maker’s inventory management as much as an end investor’s decision.




