
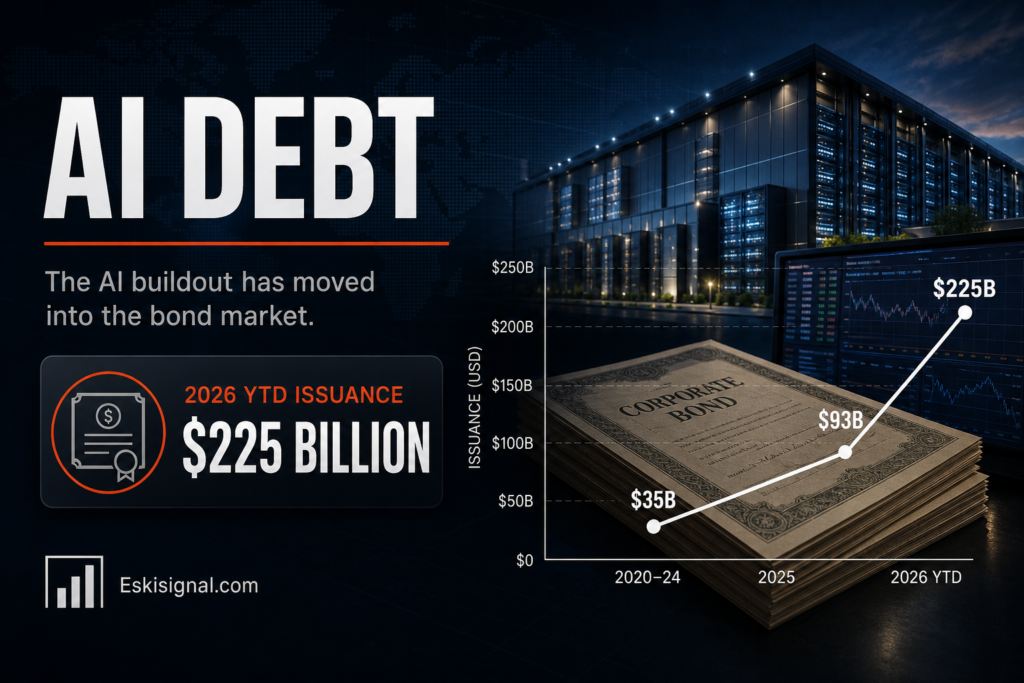
Between 2020 and 2024, the five largest hyperscalers issued roughly $35 billion of bonds a year between them. These are companies whose defining financial characteristic was having more cash than they knew what to do with. In 2025 the figure rose to $93 billion. So far in 2026 hyperscalers and related entities have issued around $225 billion, including a single multitranche deal of roughly $53 billion and a bond that matures in one hundred years. The AI capital cycle has arrived in the credit market, and the credit market is a different audience from the equity market.
This article is for informational and educational purposes only. It is not financial advice, investment advice, or a recommendation to buy, sell, or hold any security, cryptocurrency, or financial product. Always verify data with official sources before making financial decisions.
Short answer: cash flow stopped covering the build
Short answer: Companies with substantial cash balances borrow for two reasons — because borrowing is cheaper than the alternative, or because internal cash is no longer sufficient for the spending programme at the intended pace. Both are true here in different proportions at different companies, and the composition matters. What changes when the funding shifts from retained earnings to public debt is not the spending itself but who bears the risk of the spending being wrong, and how visibly that risk gets priced.
Why the equity market and the bond market disagree by design
An equity holder owns the upside. If a data centre build produces a decade of high-return cloud revenue, that accrues to the shareholder, which is why an aggressive capital programme with a credible payoff can raise a share price.
A bondholder does not own the upside. The best outcome available to them is repayment in full and on time; everything above that goes to someone else. Their entire analysis is therefore about downside, and rising leverage at a company whose asset base is shifting from software toward depreciating physical infrastructure is a deterioration from their perspective even if the equity story is intact.
This asymmetry explains something that otherwise looks contradictory: credit spreads on these issuers widening while their share prices hold. The two markets are not disagreeing about the facts. They are being paid differently for the same facts.
| Hyperscaler bond issuance | Amount |
|---|---|
| 2020-24 annual average | ~$35 billion |
| 2025 full year | ~$93 billion |
| 2026 year to date | ~$225 billion |
| Wider AI ecosystem, 2026 estimates | $300-570 billion |
What a $53 billion deal does to the market it lands in
An investment grade bond fund benchmarked to a broad index has to hold roughly what the index holds. When a small number of issuers become a materially larger share of that index in the space of eighteen months, every passive and benchmark-aware portfolio in the asset class acquires more exposure to a single industrial theme without any manager choosing to.
This is the same concentration mechanic that equity investors have spent two years discussing in the S&P 500, arriving in a market that discusses it less. It has a particular consequence in credit: index-driven demand is price-insensitive on the way in, which helps large deals clear at tight spreads, and it provides no support at all if the theme sours, because index funds do not buy dips — they buy weights.
The century bond is worth pausing on for the same reason. A hundred-year maturity is not a financing decision so much as a statement about confidence in an issuer’s franchise, and it transfers an extraordinary amount of duration risk to whoever buys it. Historically these have been issued at cycle peaks by the most unimpeachable credits available, which is a description that has often looked different in retrospect.
The borrowing that is not in the bond totals
Public bond issuance is the visible portion. A significant amount of data centre financing sits in structures that never appear in an issuer’s bond total: joint ventures with developers, special purpose vehicles holding individual sites, finance leases, and private credit facilities arranged bilaterally rather than syndicated publicly.
Estimates of this wider borrowing run to well over a trillion dollars, and the range between credible estimates is wide precisely because the structures are not uniformly disclosed. That uncertainty is itself the finding. Aggregate figures for AI-related leverage should be read as order-of-magnitude indications rather than measurements, and any analysis resting on a precise total is resting on something that does not exist.
| Funding channel | Visibility | Where to find it |
|---|---|---|
| Public bonds | High | Prospectuses, issuance trackers, 10-K debt note |
| Finance leases | Moderate | Lease note and financing activities in cash flow statement |
| JVs and SPVs | Low | Equity method note, commitments and contingencies |
| Private credit facilities | Low | Rarely disclosed by borrower; sometimes visible in BDC filings |
The honest counterargument
The bearish framing of this issuance is easy to write and worth resisting on the evidence.
These remain among the most creditworthy corporate borrowers in the world by any conventional measure — net cash positions at several, enormous operating cash generation, and interest coverage ratios that are not remotely stressed. Borrowing at attractive fixed rates to fund assets with long useful lives is textbook corporate finance rather than a warning sign, and a company that funds a twenty-year asset from one year of retained earnings is arguably the one making the mistake. The 973% growth figure is also flattered by an almost trivially small base: multiplying a number that was near zero produces impressive percentages and modest information.
The response is not that the credits are weak. It is that the marginal buyer of a hundred billion dollars of new paper is not the same investor as the marginal buyer of the first ten, and that spread widening at unchanged fundamentals is the market saying so.
What this article does not conclude
Nothing here assesses the creditworthiness of any issuer, forecasts spreads, or judges whether the underlying capital spending will earn its cost. Issuance totals circulating in commentary vary by tens of billions depending on which entities are counted as hyperscalers, whether utilities and developers are included, and how joint ventures are treated — the figures used here are drawn from published market coverage and should be treated as approximations.
The primary sources are the issuers’ own filings: the debt note, the lease note and the financing section of the cash flow statement. They are less convenient than an aggregate and considerably more reliable.




