
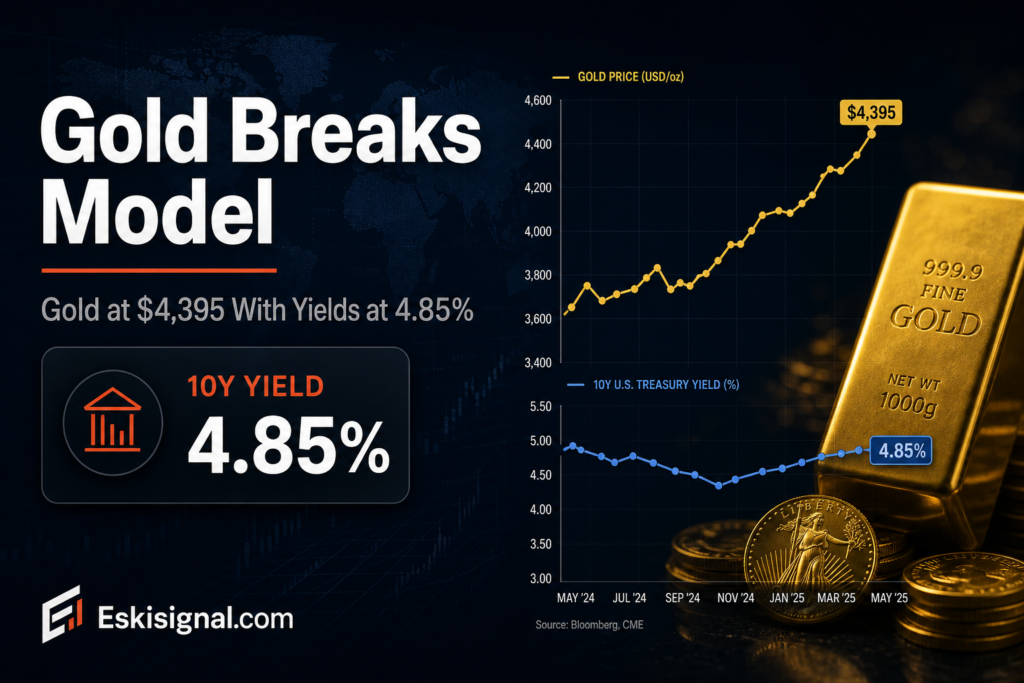
For most of the past two decades, one relationship explained the gold price better than any other: gold falls when real yields rise. The logic is clean. Gold pays no income, so the cost of owning it is the yield forgone on an inflation-protected government bond. This week the 10-year Treasury yield reached its highest level since October 2023 and gold traded near $4,395. Whatever is setting the gold price now, it is not the model in the textbook.
This article is for informational and educational purposes only. It is not financial advice, investment advice, or a recommendation to buy, sell, or hold any security, cryptocurrency, or financial product. Always verify data with official sources before making financial decisions.
Short answer: the marginal buyer changed
Short answer: The inverse relationship between real yields and gold holds when the marginal buyer is a financial investor choosing between assets on expected return. It weakens when the marginal buyer is a central bank allocating reserves for reasons that have nothing to do with expected return. Official sector purchases have run at record levels — a record 289 tonnes in the second quarter alone, following a first quarter that set a record for value at roughly $37 billion, with the People’s Bank of China extending its buying streak to twenty-two consecutive months. A price-insensitive buyer breaks a price-sensitive model.
Why the old model worked, and what it assumed
The real yield framework treats gold as a zero-coupon, zero-credit-risk, infinite-maturity asset. Its competitor is therefore the closest available instrument with those properties plus a coupon: an inflation-linked government bond. If the real return on that bond rises, holding gold instead becomes more expensive in opportunity-cost terms, and demand should fall.
The assumption buried in that reasoning is that the government bond is genuinely free of credit and confiscation risk for the holder in question. For a pension fund in the currency of its own liabilities, that assumption is reasonable. For a central bank holding reserves in a currency issued by a country that has demonstrated a willingness to immobilise foreign official assets, it is not obviously reasonable at all. Gold’s distinguishing property for that holder is not that it lacks a coupon. It is that it lacks a counterparty.
| Buyer | Decision rule | Sensitivity to real yields |
|---|---|---|
| Financial investor / ETF | Expected return vs alternatives | High |
| Central bank reserve manager | Reserve composition policy, counterparty risk | Low |
| Jewellery and bar demand | Income, price level, cultural demand | Low, but price-elastic |
| Producer hedging | Forward curve, cost base | Indirect |
The evidence that this is genuinely a regime change and not a lag
Models break temporarily all the time, and the usual explanation is that one leg is slow to adjust. Two features of this episode argue against that reading.
The first is duration. This is not a few weeks of divergence; official purchases have run at elevated levels for years, with 2026 on pace for roughly 850 tonnes, and the price has trended up through multiple distinct rate environments in that period. A relationship that fails across several different regimes is not lagging.
The second is the behaviour on down days. Reporting through this year has repeatedly described central banks accelerating purchases into price weakness — buying more after the worst week of the year rather than less. That is the signature of a policy-driven allocator working to a target weight, and it is the opposite of how a return-seeking investor behaves.
The alternative explanation nobody can rule out
There is a second possibility that produces the same price action without requiring the model to be broken: the real yield is being measured wrongly.
A real yield is a nominal yield minus expected inflation, and expected inflation is not observable. The standard proxy is the breakeven derived from inflation-linked bonds, which is itself a market price containing a liquidity premium and an inflation risk premium. If the market’s true expected inflation is higher than breakevens imply — plausible in a year with an oil shock, a record diesel crack and tariff passthrough still working through goods — then measured real yields overstate actual real yields, and gold’s behaviour is consistent with the old model applied to a number we cannot see.
This explanation is unfalsifiable in real time, which is a weakness rather than a strength. It is included because the alternative — declaring a forty-year relationship dead on two years of data — carries its own risk.
| What to track | Source | Why it matters here |
|---|---|---|
| Official sector purchases | World Gold Council quarterly demand trends | The buyer that broke the model |
| Reported PBoC reserves | Monthly Chinese official reserve data | Streak continuation or pause |
| ETF holdings | Fund-level daily tonnage | Whether financial demand has re-engaged |
| 10-year TIPS yield | Treasury par real curve | The measured real yield the model uses |
The honest counterargument
Central bank demand, while large in tonnage, is small relative to total annual gold flows including jewellery, recycling and investment. Attributing a doubling of the price primarily to official purchases attributes a great deal to a minority of demand.
The stronger version of that objection is that price is set at the margin, and the marginal buyer in a thin market can matter far more than its share of volume suggests — but the objection stands as a caution against tidy single-cause explanations. Retail bar and coin demand has also been running near record levels, and momentum in a rising market attracts flows for no reason more sophisticated than that the price is rising.
What this article does not conclude
Nothing here forecasts the gold price, the silver price, the gold-silver ratio, or the path of real yields. The claim is narrower than it may appear: that a specific historical correlation has weakened, and that the most likely explanation is a change in the composition of demand rather than a change in the properties of the metal.
Prices cited are spot levels as of 8 September 2026 and move continuously. Central bank purchase data is compiled by the World Gold Council from official reporting and is subject to revision and to under-reporting by institutions that do not disclose promptly, which is a known limitation of the series rather than a criticism of it.




