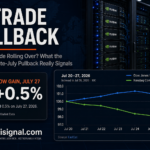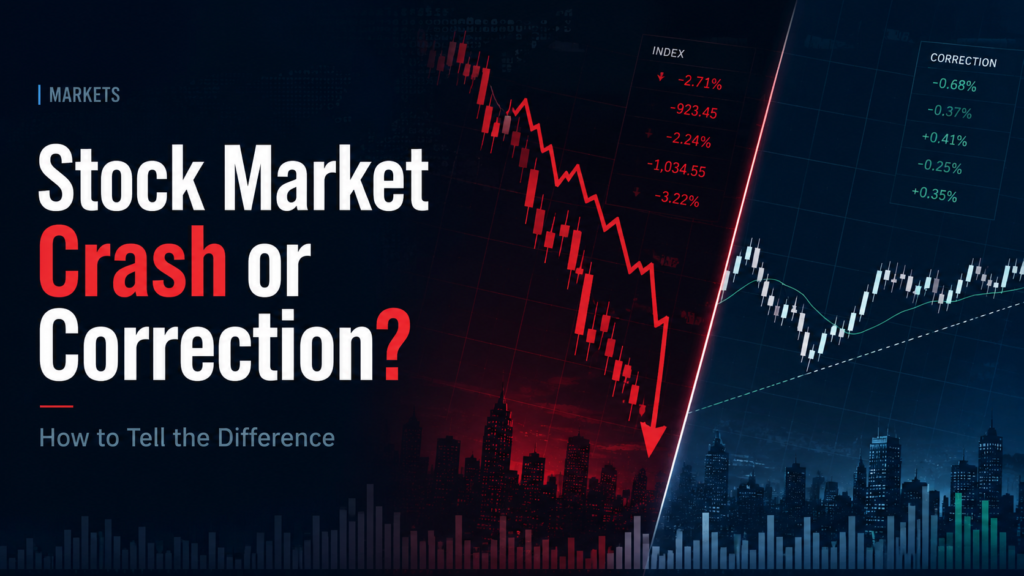
Quick answer: A market correction is a decline of 10% or more from a recent high. A crash is typically a sudden decline of 20%+ over a very short period (days or weeks). The S&P 500 is down from its 2026 high but not yet in correction territory — the current selloff is driven by inflation/yield pressure and geopolitical risk, not a fundamental demand collapse.
Last updated: June 9, 2026 · 8:00 a.m. ET
Definitions: Crash, Correction, Bear Market
| Term | Definition | Duration | Typical Cause |
|---|---|---|---|
| Pullback | Decline of 5%–9.9% from recent high | Days to weeks | Profit-taking, positioning |
| Correction | Decline of 10%–19.9% from recent high | Weeks to months | Rate fears, earnings, macro surprise |
| Bear Market | Decline of 20%+ from recent high | Months to years | Recession, credit crisis, systemic event |
| Crash | Rapid 20%+ decline (days to weeks) | Very short onset | Panic, leverage unwind, liquidity crisis |
5 Signals That Separate a Crash From a Correction
- Credit spreads. Investment-grade and high-yield credit spreads blow out in crashes (systemic risk); they stay relatively contained in corrections.
- VIX level. Corrections see VIX 20–30. Crashes push VIX above 40–50 (2020 COVID: 85.47).
- Earnings revisions. In corrections, forward EPS estimates hold or dip slightly. In crashes/bear markets, estimates collapse.
- Fed response. Corrections rarely force emergency Fed action. Crashes often prompt emergency rate cuts or liquidity facilities.
- Breadth. Corrections often hit growth/high-multiple names harder while defensives hold. Crashes hit everything.
📈 Why Nvidia Drops on Inflation Days — NVDA Selloff Pattern →
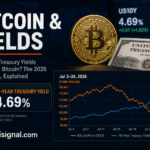
₿ Why Is Crypto Crashing? Bitcoin and Tech Selloff Connection →
📊 Volatility & Sentiment — VIX & Risk Signals →
Current Market Context (June 2026)
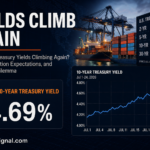
The current U.S. equity selloff has been driven by three overlapping forces: April CPI at 3.8% pushing Treasury yields higher (10-year above 4.6%, 30-year above 5.1%), the Iran conflict keeping oil prices elevated (Brent $100+), and rotation away from high-multiple AI/semiconductor names. The VIX surged to ~18.5 — elevated but well below crash thresholds. Credit spreads have not blown out. This looks more like a correction/pullback than a systemic crash.
Historical Context
| Event | Peak-to-Trough Decline | Duration | Type |
|---|---|---|---|
| COVID crash (Feb–Mar 2020) | −33.9% (S&P 500) | ~33 days | Crash |
| 2022 bear market | −25.4% (S&P 500) | ~9 months | Bear market |
| Aug 2024 correction | −8.5% | ~3 weeks | Pullback |
| Current 2026 selloff | TBD | Ongoing | Pullback/correction |
🏦 When Will the Fed Cut Rates? Conditions & Next FOMC →
📅 CPI June 10 Preview — The Key Macro Data Point →
🌐 Commodities — Oil, Gold & Energy →
FAQ
Is the stock market crashing right now?
As of June 2026, the selloff in U.S. equities is driven by inflation and yield concerns — not a systemic credit or liquidity event. VIX near 18.5 and contained credit spreads suggest pullback/correction territory, not crash.
How long do corrections last?
Historically, S&P 500 corrections average 3–4 months from peak to trough. But duration varies widely depending on whether a recession follows.
Should I sell during a correction?
EskiSignal does not provide investment advice. Decisions about selling depend on individual time horizon, risk tolerance, and tax situation — consult a qualified financial professional.
Sources
- Cboe — VIX historical data: cboe.com/vix
- U.S. Treasury — Yield data: home.treasury.gov
- S&P Global — Historical correction data
Not financial advice. Written by Aybars Y. · EskiSignal Editorial · June 9, 2026