Last updated: June 17, 2026, 3:30 PM ET
Topic: bond market and the yield curve (educational explainer).
This article is for informational and educational purposes only. It is not financial advice, investment advice, or a recommendation to buy, sell, or hold any security, cryptocurrency, or financial product. Always verify data with official sources before making financial decisions.
Short answer: what is a yield curve inversion?
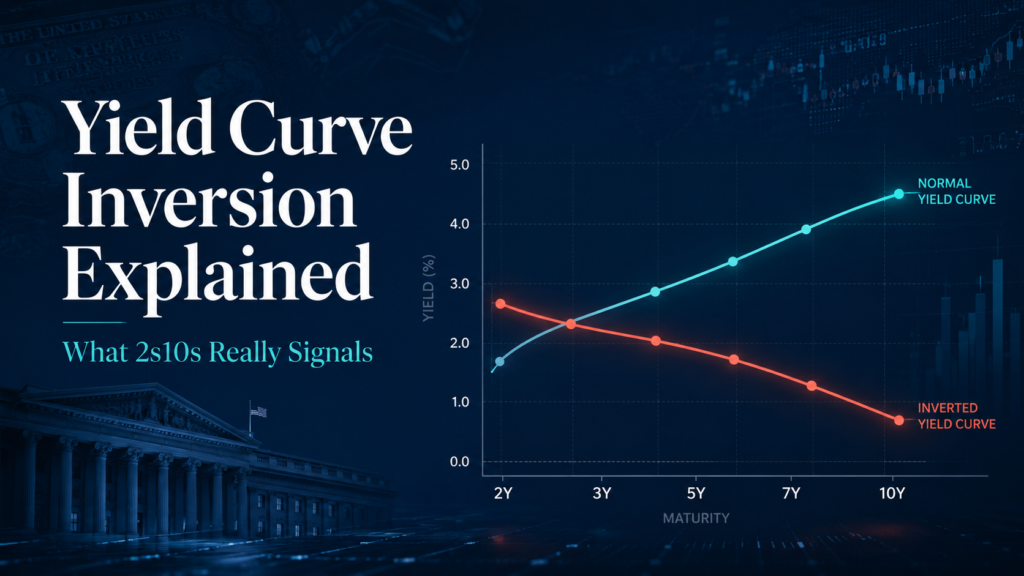
The yield curve plots the yields of U.S. Treasury securities from short to long maturities. Normally it slopes upward — longer-term bonds pay more than shorter-term ones. An inversion happens when shorter-term yields rise above longer-term yields, so the curve slopes downward in part. The most-watched version compares the 2-year and 10-year Treasury yields (the “2s10s” spread). Inversions have historically drawn attention because they have preceded several past U.S. recessions — though they are a signal of market expectations, not a guarantee.
Normal vs inverted curve
| Shape | What it looks like | Common interpretation |
|---|---|---|
| Normal (upward) | Long yields > short yields | Market expects steady growth |
| Flat | Short and long yields similar | Uncertainty about the path ahead |
| Inverted | Short yields > long yields | Market expects future rate cuts / slowing |
Why inversions happen
Short-term Treasury yields are heavily influenced by the Federal Reserve’s policy rate. When the Fed holds rates high to fight inflation, short yields stay elevated. Long-term yields reflect expectations for future growth and inflation; if investors expect the economy to slow and the Fed to eventually cut, long yields can fall below short yields. That gap is the inversion. It is essentially the bond market pricing in a different future than the present.
What an inversion does — and does not — tell you
- Does: summarize the market’s expectation that short rates may fall later.
- Does: have a historical association with later economic slowdowns.
- Does not: set a timeline — the lag between inversion and any slowdown has varied widely.
- Does not: guarantee a recession, and it is not a trading signal.
A real-world framing
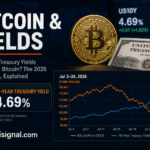
Heading through 2026, with the Fed holding its policy rate in a 3.50%–3.75% range and inflation elevated on energy, the relationship between short and long yields is exactly what the curve captures. Watching whether the 2s10s spread is positive, flat, or inverted is one way to read how the bond market views the growth-versus-inflation trade-off — alongside, not instead of, the actual data.
Where it shows up on EskiSignal
- June 2026 FOMC Meeting — how Fed policy anchors short yields.
- May 2026 CPI Report — inflation, which long yields reflect.
- When Will the Fed Cut Rates? — rate-cut expectations.
Mini glossary
| Term | Plain-English meaning |
|---|---|
| Yield | The return a bond pays at its current price |
| 2s10s spread | 10-year yield minus 2-year yield |
| Inversion | When short yields exceed long yields |
| Term premium | Extra yield investors want for holding longer bonds |
Risks, uncertainty, and limits
- The inversion-recession link is historical, not mechanical, and timing varies.
- Different maturity pairs (e.g., 3m/10y) can give different signals.
- This is educational content, not a forecast or advice.
What this article does not conclude
This explainer defines the yield curve and inversion. It does not predict a recession or recommend any action.
What does an inverted yield curve mean?
It means shorter-term Treasury yields are higher than longer-term yields, which the bond market often reads as an expectation that the Fed may cut rates as growth slows.
Does a yield curve inversion guarantee a recession?
No. Inversions have preceded several past recessions, but the relationship is historical, not guaranteed, and the timing has varied widely.
What is the 2s10s spread?
It is the 10-year Treasury yield minus the 2-year yield. When it turns negative, that part of the curve is inverted.
Why do short-term yields rise above long-term yields?
Short yields track the Fed’s policy rate closely. When the Fed holds rates high while investors expect future cuts, long yields can fall below short yields.
Sources
- U.S. Department of the Treasury — daily Treasury yield curve rates.
- Federal Reserve research on the yield curve and economic activity.