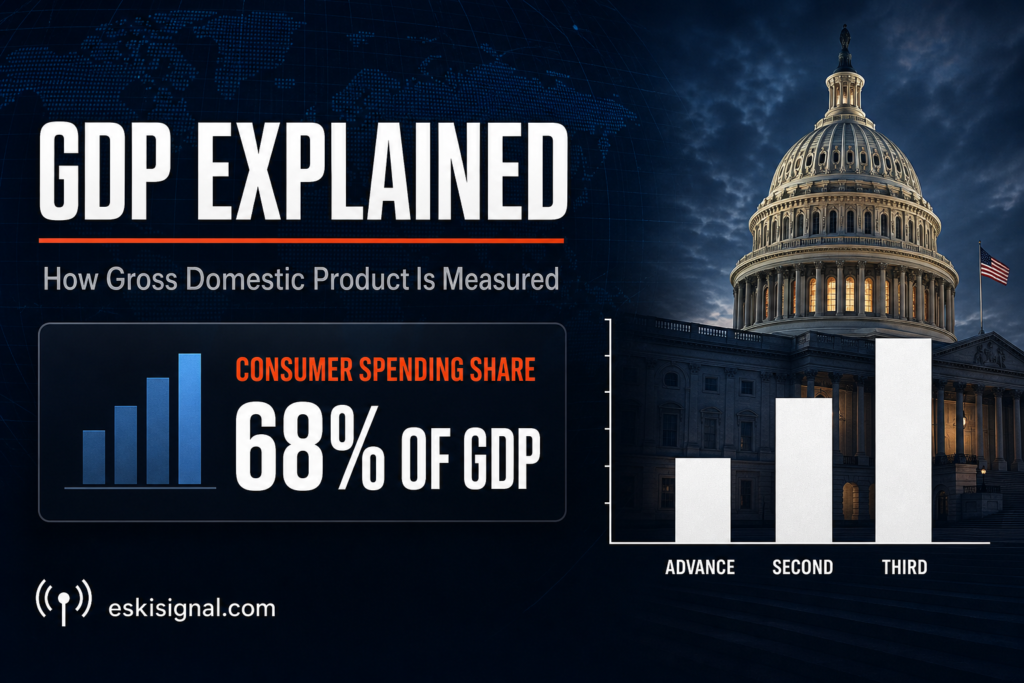
The GDP number that moves markets on release day is almost never the final word. It’s an estimate built from incomplete data, revised twice more in the following months, and sometimes revised again years later once more complete records come in. Traders who react hard to the first headline are often reacting to a number the government itself will quietly rewrite.
This article is for informational and educational purposes only. It is not financial advice, investment advice, or a recommendation to buy, sell, or hold any security, cryptocurrency, or financial product. Always verify data with official sources before making financial decisions.
Quick answer: what is GDP and how is it measured?
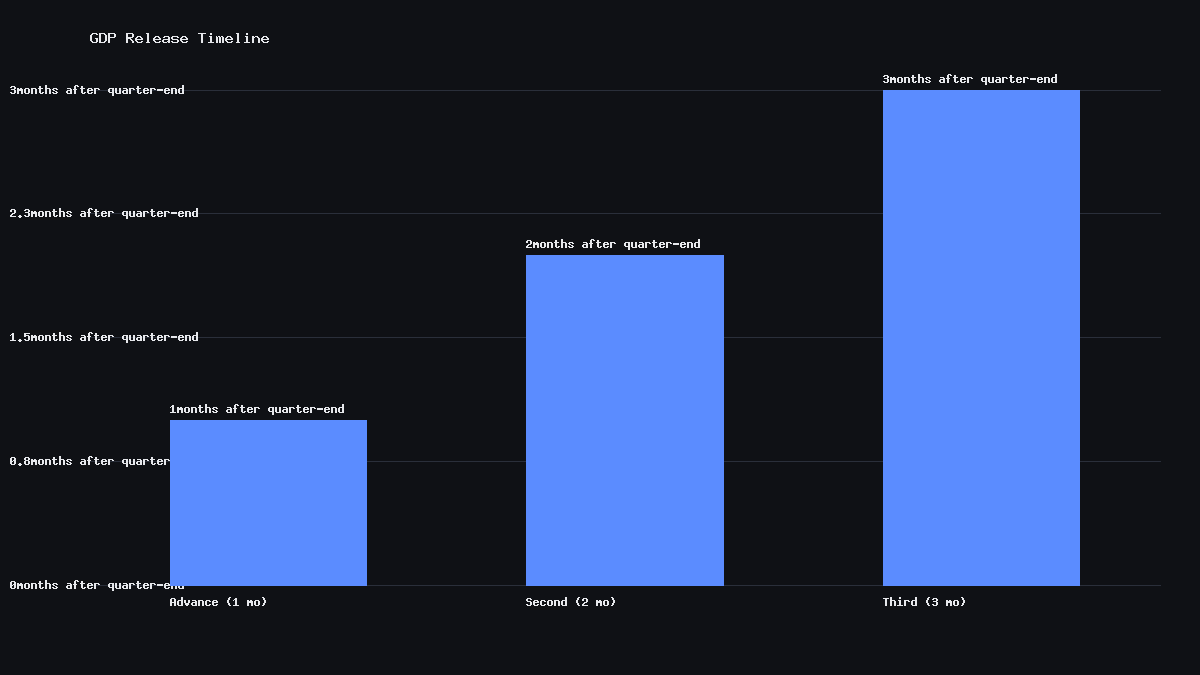
Quick answer: Gross Domestic Product (GDP) is the total dollar value of all goods and services produced within a country in a given period, and it’s the single most-watched gauge of economic growth. In the US, the Bureau of Economic Analysis (BEA) releases GDP for each quarter three times — an advance estimate about a month after the quarter ends, a second estimate a month later, and a third estimate a month after that — as more complete source data becomes available. Markets react most to the advance estimate because it’s first, even though it’s built on the most incomplete data of the three.
How GDP is actually calculated
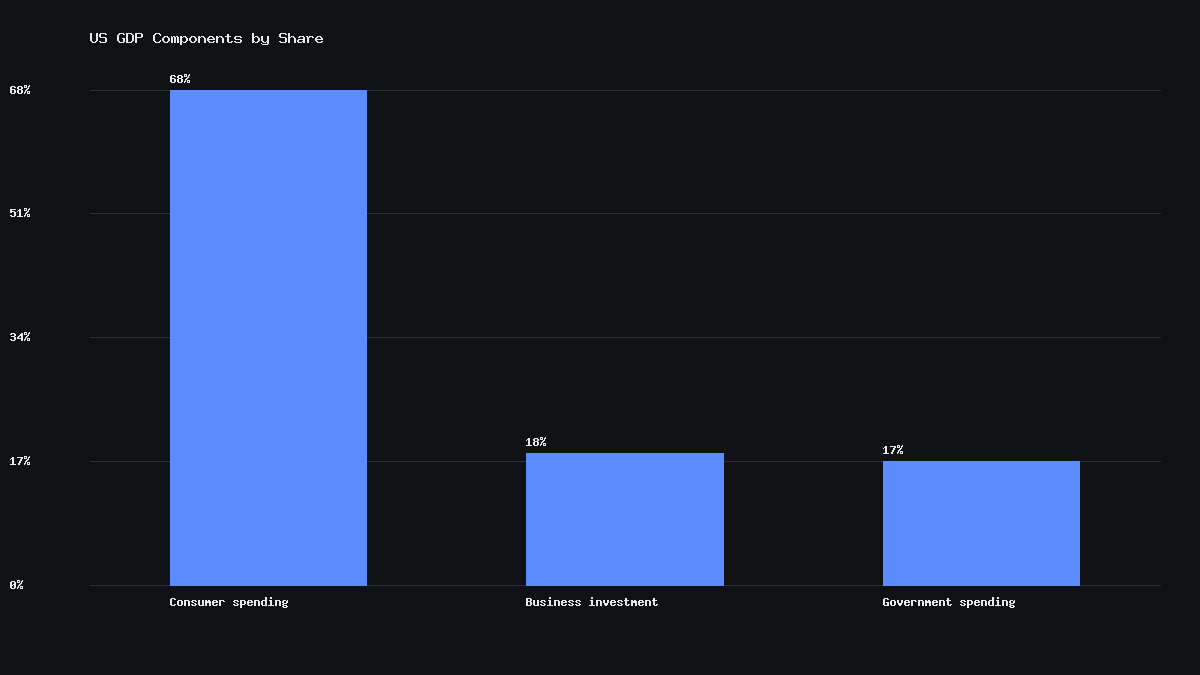
The BEA calculates GDP using the expenditure approach, which adds up spending across four categories: consumer spending, business investment, government spending, and net exports (exports minus imports). The formula is often written as GDP = C + I + G + (X − M). Consumer spending is by far the largest component of US GDP, typically making up more than two-thirds of the total, which is why retail sales and consumer sentiment data are watched so closely as early signals of where GDP is heading.
| Component | What it captures | Approx. share of US GDP |
|---|---|---|
| Consumer spending (C) | Household purchases of goods and services | ~68% |
| Business investment (I) | Spending on equipment, structures, and inventories | ~18% |
| Government spending (G) | Federal, state, and local government purchases | ~17% |
| Net exports (X − M) | Exports minus imports | Typically negative for the US |
Why GDP gets revised three times
The three-estimate cycle exists because not all the underlying source data is available at the same time. Some data — like international trade figures and detailed corporate earnings — takes longer to compile than others. Rather than wait months for a single, more complete number, the BEA publishes its best estimate early and refines it as better data arrives.
| Estimate | Released | Data completeness |
|---|---|---|
| Advance estimate | ~1 month after quarter ends | Based on incomplete source data, subject to the largest revisions |
| Second estimate | ~2 months after quarter ends | Incorporates more complete trade and inventory data |
| Third estimate | ~3 months after quarter ends | Most complete of the three quarterly releases |
Beyond the three quarterly estimates, the BEA also conducts annual revisions each summer and a comprehensive revision roughly every five years that can reach back decades, incorporating new source data, updated methodologies, and definitional changes. These deeper revisions rarely move markets in real time, but they matter for anyone doing long-term historical comparisons — a GDP growth rate reported for a given quarter years ago may not exactly match what’s shown in today’s historical database.
GDP vs GNP: a common mix-up
GDP measures production that happens within a country’s borders, regardless of who owns the business doing the producing. Gross National Product (GNP), by contrast, measures output produced by a country’s residents and companies, regardless of where in the world that production happens. A US company’s factory in Vietnam counts toward Vietnam’s GDP but the US’s GNP; a foreign company’s factory in Ohio counts toward US GDP but not US GNP. For most large, diversified economies like the US, the two numbers are close, but the gap can be meaningful for countries with large multinational corporate bases or significant foreign-owned production.
Why markets react so hard to the advance estimate
Despite being the least complete of the three quarterly releases, the advance GDP estimate typically triggers the sharpest market reaction because it’s the first hard data point on how the economy performed last quarter. Bond yields, the dollar, and rate-cut expectations can all shift within minutes of the release if growth comes in meaningfully above or below consensus forecasts — because GDP surprises feed directly into how traders price the Fed’s next move. A stronger-than-expected reading can push back rate-cut bets; a weaker one can pull them forward.
Risks and limits
- The advance estimate is built on the most incomplete data of the three quarterly releases and is subject to the largest revisions.
- GDP measures total output but says little on its own about distribution — how growth is shared across income groups or regions.
- Quarterly GDP is reported at a seasonally adjusted annual rate, which can be confusing when compared to raw year-over-year figures.
- This is educational content describing how GDP is measured and revised — it is not a forecast of future economic growth.
Mini glossary
| Term | Plain-English meaning |
|---|---|
| GDP | Total dollar value of goods and services produced within a country |
| GNP | Total output produced by a country’s residents and companies, anywhere in the world |
| Advance estimate | The first, least complete GDP estimate for a quarter |
| Annualized rate | A quarterly growth figure scaled up to show what it would equal over a full year |
Why is the advance GDP estimate so often revised?
The advance estimate is published before all the underlying source data — particularly detailed trade and inventory figures — is fully available. As that data arrives, the BEA incorporates it into the second and third estimates, which is why the number can shift, sometimes significantly, over the following two months.
What’s the difference between real GDP and nominal GDP?
Nominal GDP measures output at current prices, including the effect of inflation. Real GDP strips out inflation’s effect, so it reflects actual changes in the quantity of goods and services produced. Economists and the Fed focus primarily on real GDP growth when assessing the economy’s health.
How often is GDP reported?
US GDP is reported quarterly, with each quarter getting three successive estimates over roughly three months, plus annual revisions each summer and a comprehensive revision approximately every five years.
What counts as two consecutive quarters of negative GDP growth?
Two straight quarters of negative real GDP growth is a commonly cited informal rule of thumb for a recession, but it is not the official definition. In the US, the National Bureau of Economic Research (NBER) determines recessions using a broader set of indicators, including employment, income, and industrial production, not GDP alone.
Sources
- US Bureau of Economic Analysis (BEA), GDP release schedule and estimation methodology.
- National Bureau of Economic Research (NBER), recession dating methodology.
- BEA documentation on GDP vs GNP definitions and historical revision practices.